 Global| Feb 02 2006
Fleet Purchases Raised U.S. Vehicle Sales in January
by:Tom Moeller
|in:Economy in Brief
Summary
The Autodata Corporation reported that in January, US light vehicle sales rose 2.7% from December to 17.64M units. Consensus expectations had been for a decline to 16.3M. The surprise stemmed from a 25.7% (23.9% y/y) rise in sales of [...]
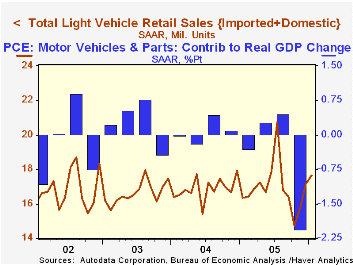
The Autodata Corporation reported that in January, US light vehicle sales rose 2.7% from December to 17.64M units. Consensus expectations had been for a decline to 16.3M.
The surprise stemmed from a 25.7% (23.9% y/y) rise in sales of US made cars as automakers "restocked" rental fleets. In contrast, imported car sales fell 18.9% (-7.0% y/y). 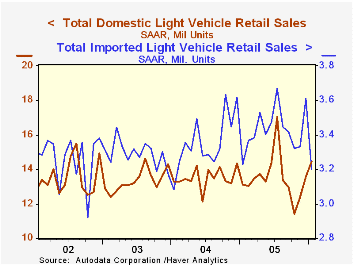
Sales of domestic trucks also fell 5.9% (+0.5% y/y) though sales of imported trucks added 2.9% (9.5% y/y) to the sharp 12.5% increase during December.
Imports' share of the US light vehicle market fell sharply to 18.1% from 21.0% during December.
Consumption-based macroeconomic forecasting from the Federal Reserve Bank of Chicago is available here.
| Light Vehicle Sales (SAAR, Mil. Units) | Jan | Dec | Y/Y | 2005 | 2004 | 2003 |
|---|---|---|---|---|---|---|
| Total | 17.64 | 17.17 | 7.9% | 16.92 | 16.87 | 16.63 |
| Autos | 8.56 | 7.64 | 15.4% | 7.65 | 7.49 | 7.62 |
| Trucks | 9.08 | 9.53 | 1.7% | 9.27 | 9.37 | 9.01 |
by Tom Moeller February 2, 2006
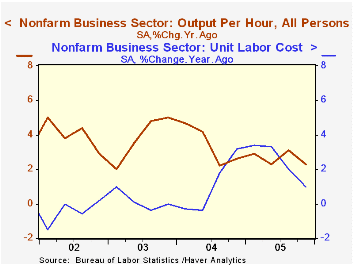
Non-farm labor productivity fell last quarter after a revised 4.5% increase during 3Q. It was the first decline in output per hour since 1Q '01 and followed an average gain of 3.7% during the prior ten quarters. Consensus expectations had been for a 1.5% increase.
Slower output growth accounted for the drop in productivity. The marked slowdown in output to 0.9% (3.6% y/y) from 4.7% during 3Q was accompanied by an acceleration in hours worked to 1.5% (1.2% y/y) from 0.1%.
Compensation costs rose 2.8% after an upwardly revised 3Q increase. As a result, unit labor costs rose 3.5%, the quickest gain in a year.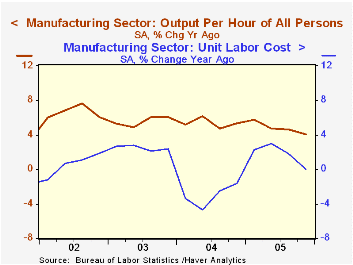
Factory sector productivity growth rose a firm 3.9% (4.1% y/y) during 4Q following a 3.7% gain during 3Q. Compensation growth slowed to 1.9% (4.1% y/y) from 3.7% and unit labor costs in the factory sector fell 1.9% (0.0% y/y) as a result.
The implicit price deflator for the nonfarm business sector rose 3.2% (3.1% y/y). Since the increase trailed the rise in costs, the ratio of prices to unit labor costs slipped from the record high of the prior quarter. During the last ten years there has been a 60% correlation between the ratio and the y/y growth in operating corporate profits.
| Non-farm Business Sector (SAAR) | 4Q '05 | 3Q '05 | Y/Y | 2005 | 2004 | 2003 |
|---|---|---|---|---|---|---|
| Output per Hour | -0.6% | 4.5% | 2.3% | 2.7% | 3.4% | 3.8% |
| Compensation | 2.8% | 4.1% | 3.3% | 5.2% | 4.5% | 4.0% |
| Unit Labor Costs | 3.5% | -0.5% | 1.0% | 2.4% | 1.1% | 0.2% |
by Tom Moeller February 2, 2006
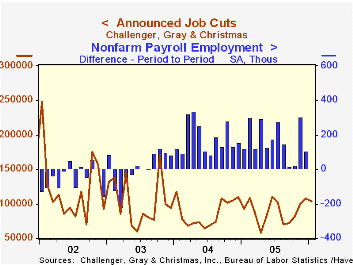
Challenger, Grey & Christmas reported that January job cut announcements reversed about half of the rise in December and fell 4.0% to 103,466.
Like the December report, one industry dominated the monthly total. Auto industry layoff announcements rose nearly ten fold from December on the heels of a December report when layoffs in government rose more than three times (reversed in January). Layoffs in the retail industry also surged m/m and were more than three times higher than last January.
During the last ten years there has been an 84% (inverse) correlation between the three month moving average of announced job cuts and the three month change payroll employment.
Job cut announcements differ from layoffs. Many are achieved through attrition, early retirement or just never occur.
Challenger also reported the second consecutive sharp m/m drop in announced hiring plans and they were down 53.3% from a year ago.
| Challenger, Gray & Christmas | Jan | Dec | Y/Y | 2005 | 2004 | 2003 |
|---|---|---|---|---|---|---|
| Announced Job Cuts | 103,466 | 107,822 | 12.0% | 1,072,054 | 1,039,935 | 1,236,426 |
by Tom Moeller February 2, 2006
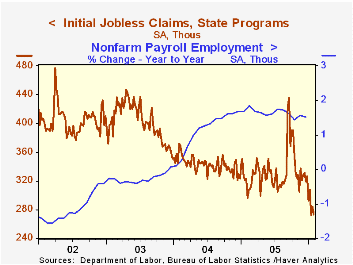
Initial claims for unemployment insurance reversed the prior week's little revised gain and fell 11,000 to 273,000. Consensus expectations had been for an increase to 295,000 claims.
During the last ten years there has been a (negative) 75% correlation between the level of initial jobless insurance claims and the m/m change in payroll employment.
The four-week moving average of initial claims fell further to 284,250 (-13.9% y/y), its lowest level since June 2000.
Continuing unemployment insurance claims also reversed the prior week's downwardly revised increase and fell 64,000.
The insured rate of unemployment fell back to the lowest level since early 2001, at 1.9% from 2.0% the prior week.
| Unemployment Insurance (000s) | 01/28/06 | 01/21/06 | Y/Y | 2005 | 2004 | 2003 |
|---|---|---|---|---|---|---|
| Initial Claims | 273 | 284 | -15.5% | 332 | 343 | 402 |
| Continuing Claims | -- | 2,509 | -7.2% | 2,663 | 2,924 | 3,532 |
by Carol Stone February 2, 2006
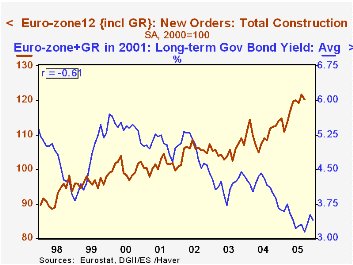
Low interest rates tend to help construction, and this has been the case in Europe recently.Eurostat this morning reported construction orders through Q3 2005 for the region as a whole and for selected countries through November. Specific performance varies by country, but the renewal of this sector for the area as a whole is impressive. These orders cover contracts for nonresidential projects, including buildings and infrastructure.
Construction orders for the entire Euro-Zone 12 actually eased 1.1% in September from August, but the level over the last few months was running about 10% above 2004 amounts. Spain is a good example of the strength, with September's value almost 18% higher than a year ago. The UK, a member of the European Union ("EU-25"), but not the Euro-Zone, is also seeing a strong advance, with November's index 123.0 (2000=100) up 14% from November 2004.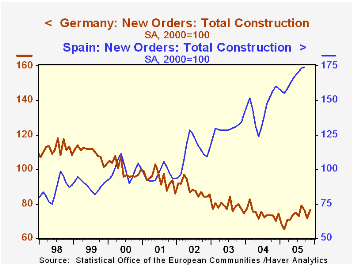
Germany looks to be a special case here. Its construction sector has long been in decline, basically for more than 10 years. But the last several months have seen a stabilization and some modest gains. The upturn is not steep, but for that reason, perhaps it can last a good while. Both buildings and infrastructure construction are participating, although the latter is more uneven.
Among the entire Euro-Zone, the index for buildings was 122.66 in September, up 10.1% from the year-earlier month; it averaged 122.08 in Q3, up 11.9%. Civil engineering orders were 116.49 in September, just 2.8% above September 2004, but they are more irregular than smaller project orders; the quarterly average was 117.82, up 5.0% on the year. As seen in the first graph, these orders all together have a 61% negative correlation with long-term interest rates. These latter, though, have been rising for the last few months. Will that constrain the vigor of this building activity? Possibly, but the rate increase is quite modest and the level remains near the lowest for the history of this average of European yields since 1990.
| EU-12 & Select Countries, 2000=100 | Nov 2005 | Oct 2005 | Sept 2005 | Aug 2005 | 2004 | 2003 | 2002 |
|---|---|---|---|---|---|---|---|
| Euro-Zone 12 | -- | -- | 120.27 | 121.66 | 110.26 | 105.29 | 105.42 |
| Germany | 76.54 | 71.86 | 76.10 | 78.99 | 74.54 | 78.46 | 88.46 |
| Spain | -- | -- | 173.89 | 173.43 | 145.16 | 130.21 | 113.29 |
| UK | 123.00 | 124.50 | 110.80 | 117.90 | 104.81 | 97.80 | 102.51 |
Tom Moeller
AuthorMore in Author Profile »Prior to joining Haver Analytics in 2000, Mr. Moeller worked as the Economist at Chancellor Capital Management from 1985 to 1999. There, he developed comprehensive economic forecasts and interpreted economic data for equity and fixed income portfolio managers. Also at Chancellor, Mr. Moeller worked as an equity analyst and was responsible for researching and rating companies in the economically sensitive automobile and housing industries for investment in Chancellor’s equity portfolio. Prior to joining Chancellor, Mr. Moeller was an Economist at Citibank from 1979 to 1984. He also analyzed pricing behavior in the metals industry for the Council on Wage and Price Stability in Washington, D.C. In 1999, Mr. Moeller received the award for most accurate forecast from the Forecasters' Club of New York. From 1990 to 1992 he was President of the New York Association for Business Economists. Mr. Moeller earned an M.B.A. in Finance from Fordham University, where he graduated in 1987. He holds a Bachelor of Arts in Economics from George Washington University.
More Economy in Brief
 Global| Feb 05 2026
Charts of the Week: Balanced Policy, Resilient Data and AI Narratives
by:Andrew Cates


