 Global| Apr 12 2005
Flat Exports & Soaring Oil Prices = Another Record U.S. Trade Deficit
by:Tom Moeller
|in:Economy in Brief
Summary
The U.S. foreign trade deficit in February surged to another record of $61.0B and exceeded Consensus expectations for a $59.0B deficit. January's figure was little revised. Total exports were unchanged for the second consecutive [...]
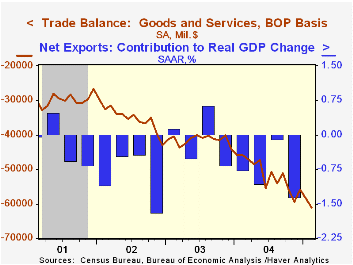
The U.S. foreign trade deficit in February surged to another record of $61.0B and exceeded Consensus expectations for a $59.0B deficit. January's figure was little revised.
Total exports were unchanged for the second consecutive month. Goods exports were about flat m/m (9.4% y/y) as a 2.7% m/m gain in industrial supplies and a 3.2% (16.6% y/y) increase in non-auto consumer goods offset declines elsewhere. Capital goods exports fell by 1.3% (+3.3% y/y) for the second consecutive m/m decline and "other" exports fell 1.6% (+1.5% y/y).
Exports of advanced technology products fell for the third month in the last four (-7.2% y/y).
Services exports were about unchanged for the second month (7.1% y/y) though passenger fares (+9.4% y/y) and spending on travel (+5.2% y/y) both fell.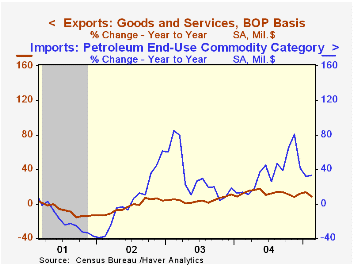
Imports of petroleum imports jumped 10.3% (+32.9% y/y) and lifted total imports by 1.6%. The average price of crude oil jumped to $36.85 per bbl. (+26.3% y/y) and imports of non-petroleum goods rose 0.6% (+16.3% y/y). Capital goods imports fell 2.5 (+14.1% y/y) and nonauto consumer goods imports rose 2.0% (21.0% y/y).
The US trade deficit with China improved m/m in February to $13.9B ($162.0B in 2004) though imports are up nearly 50% y/y). The US trade deficit with Japan deepened to $6.9B ($75.2B in 2004) and the trade deficit with the Asian NICs halved m/m to $1.1B ($21.9B in 2004). The US trade deficit with the European Union deepened to $8.5B ($110.0B in 2004) on a 7.5% y/y gain in imports.
| Foreign Trade | Feb | Jan | Y/Y | 2004 | 2003 | 2002 |
|---|---|---|---|---|---|---|
| Trade Deficit | $61.0B | $58.5B | $45.9B (2/04) | $617.1B | $496.5B | $421.7B |
| Exports - Goods & Services | 0.0% | 0.0% | 8.7% | 12.4% | 4.6% | -3.1% |
| Imports - Goods & Services | 1.6% | 1.8% | 16.8% | 16.3% | 8.5% | 2.1% |
by Tom Moeller April 12, 2005
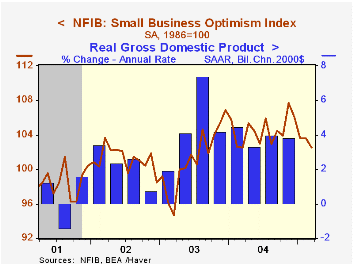
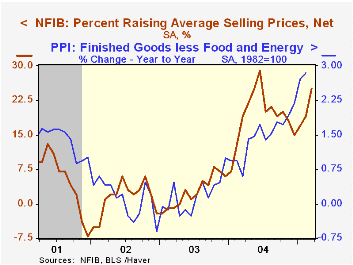
The March Small Business Optimism Index reported by the National Federation of Independent Business (NFIB) fell 1.1% from February and is down 4.8% from the peak last November. The percentage of firms expecting the economy to improve fell to 16% versus 47% in November.
During the last ten years there has been a 64% correlation between the level of the NFIB index and the two quarter change in real GDP.
The percentage of firms raising average selling prices jumped to 25%.
The percentage of firms planning to raise employment fell to 10% though the percentage of firms with one or more job openings held steady at 24%, the highest level since 2001. During the last ten years there has been a 67% correlation between these hiring plans and the three month growth in nonfarm payrolls.
The percentage of firms planning to raise capital spending improved to 36% and continued a recent trend of improvement.
About 24 million businesses exist in the United States. Small business creates 80% of all new jobs in America.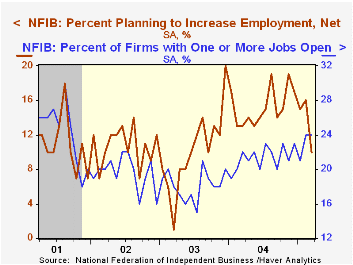
| Nat'l Federation of Independent Business | Mar | Feb | Y/Y | 2004 | 2003 | 2002 |
|---|---|---|---|---|---|---|
| Small Business Optimism Index (1986=100) | 102.5 | 103.6 | 0.0% | 104.6 | 101.3 | 101.2 |
by Tom Moeller April 12, 2005
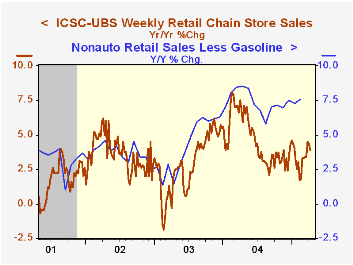
Chain store sales rose 0.3% for the second week according to the International Council of Shopping Centers (ICSC)-UBS survey. The increase last week pulled the average level in April about even with March.
During the last ten years there has been a 56% correlation between the y/y change in chain store sales and the change in non-auto retail sales less gasoline, as published by the US Census Department. Chain store sales correspond directly with roughly 14% of nonauto retail sales less gasoline.
The leading indicator of chain store sales from ICSC fell by 0.2% (-1.5% y/y), the third consecutive weekly decline.
The ICSC-UBS retail chain-store sales index is constructed using the same-store sales (stores open for one year) reported by 78 stores of seven retailers: Dayton Hudson, Federated, Kmart, May, J.C. Penney, Sears and Wal-Mart.
| ICSC-UBS (SA, 1977=100) | 04/09/05 | 04/02/05 | Y/Y | 2004 | 2003 | 2002 |
|---|---|---|---|---|---|---|
| Total Weekly Chain Store Sales | 452.9 | 451.5 | 3.9% | 4.6% | 2.9% | 3.6% |
by Louise Curley April 12, 2005
China and India recently pledged to increase their bilateral trade from the $14 billion reached in 2003 to $20 billion by 2008 and $30 billion by 2010.
Data enabling one to analyze these prospects are available in the Haver data base, IMFDOTM, which lists monthly exports to and imports from some 210 countries and 24 aggregates. Because it is so detailed, the information tends is published with a long lag. For example, the latest data available today is for November, 2004
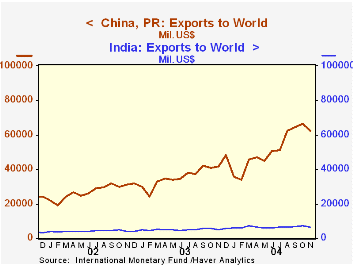
One of the first things that emerges from the bilateral trade data between China and India is the contrast between the magnitude of foreign trade of the two countries. In 2003, the last full year available, China's total exports amounted to $428.3 billion and imports, $412.8. India's total exports were $60.8 billion and imports, $69.8 billion. The monthly data for total exports of the two countries are shown in the attached chart.
Not only is there a big difference in the importance of total trade, there is also a significant difference in the importance of the bilateral trade to each country. Although the bilateral trade between India and China has been small, it has been more important to India than to China. India's exports to China amounted to 4.5% of total exports in 2003, while imports from China amounted to 5.3% of total imports. China's exports to India, in contrast, were only 0.8% of total exports and imports from India were 1.0% of total imports. In trade among all the Asian countries, India's exports to China were 16.5% of total exports to Asia and imports from China were 24.0% of Indian imports from Asia. China's exports to India accounted for only 2.3% of total Chinese exports to Asia and imports from India were only 2.7% of total Chinese imports from Asia.
| INDIA TRADE IN 2003 | Mil US$ | % | Mil US$ | ||
|---|---|---|---|---|---|
| Exports to China | 2,713.3 | Percent of Total | 4.5 | Total Trade with China | 6,447.5 |
| Exports to Asia | 16,452.8 | Percent of Asia | 16.5 | Total Trade with Asia | 31,983.9 |
| Total Exports | 30,793.7 | Total Trade | 130,620.2 | ||
| Imports from China | 3,734.2 | Percent of Total | 5.3 | ||
| Imports from Asia | 15,531.1 | Percent of Asia | 24.0 | ||
| Total Imports | 69,826.5 | ||||
| CHINA TRADE IN 2003 | |||||
| Exports to India | 3,343.6 | Percent of Total | 0.8 | Total Trade with India | 7,595. |
| Exports to Asia | 145,055.5 | Percent of Asia | 2.3 | Total Trade with Asia | 301,630.0 |
| Total Exports | 428,273.9 | Total Trade | 841,110.5 | ||
| Imports from India | 4,251.5 | Percent of Total | 1.0 | ||
| Imports from Asia | 156,574.5 | Percent of Asia | 2.7 | ||
| Total Imports | 412,836.6 |

Tom Moeller
AuthorMore in Author Profile »Prior to joining Haver Analytics in 2000, Mr. Moeller worked as the Economist at Chancellor Capital Management from 1985 to 1999. There, he developed comprehensive economic forecasts and interpreted economic data for equity and fixed income portfolio managers. Also at Chancellor, Mr. Moeller worked as an equity analyst and was responsible for researching and rating companies in the economically sensitive automobile and housing industries for investment in Chancellor’s equity portfolio. Prior to joining Chancellor, Mr. Moeller was an Economist at Citibank from 1979 to 1984. He also analyzed pricing behavior in the metals industry for the Council on Wage and Price Stability in Washington, D.C. In 1999, Mr. Moeller received the award for most accurate forecast from the Forecasters' Club of New York. From 1990 to 1992 he was President of the New York Association for Business Economists. Mr. Moeller earned an M.B.A. in Finance from Fordham University, where he graduated in 1987. He holds a Bachelor of Arts in Economics from George Washington University.
More Economy in Brief


