 Global| Jan 31 2006
Fed Funds Rate Increased to 4.50%
by:Tom Moeller
|in:Economy in Brief
Summary
At today's meeting of the Federal Open Market Committee, the target interest rate for Federal funds was raised 25 basis points to 4.50%, the fourteenth increase since June of 2004. The unanimous decision was widely expected by [...]
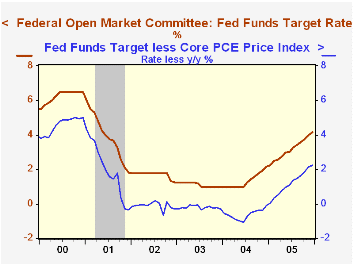
At today's meeting of the Federal Open Market Committee, the target interest rate for Federal funds was raised 25 basis points to 4.50%, the fourteenth increase since June of 2004. The unanimous decision was widely expected by analysts. The discount rate also was raised 25 basis points to 5.50%.
The economy's slowdown in 4Q05 was noted in the Fed's statement. "Although recent economic data have been uneven, the expansion in economic activity appears solid."
This latest action, therefore, had a preemptive sense to it. The FOMC's press release stated "Core inflation has stayed relatively low in recent months and longer-term inflation expectations remain contained. Nevertheless, possible increases in resource utilization as well as elevated energy prices have the potential to add to inflation pressures."
The latest statement's verbiage regarding the likelihood of future rate action was toned down slightly from "is likely to be needed" in the prior statement to "may be needed to keep the risks to the attainment of both sustainable economic growth and price stability roughly in balance."
Today's meeting was Chairman Alan Greenspan's last since taking over the Chairmanship in 1988.
For the complete text of the Fed's latest press release please clickhere.
The Fed's Monetary Policy Rule from William Poole, President of the Federal Reserve Bank of St. Louis, can be found here.
Employment Cost Index Steady Last Quarter, Down During '05by Tom Moeller January 31, 2006
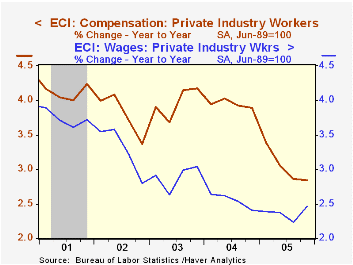
For private industry workers, the employment cost index rose a steady 0.8% last quarter. The increases during the last two quarters were up from 0.6% gains during 1Q & 2Q but they were off the 1.0% average of the prior two years. Consensus expectations had been for a 0.9% 4Q increase.
The 2.8% increase in the ECI during 2005 was the lowest in ten years.
The increase in benefit costs eased last quarter to 0.9% from the quick 1.3% during 3Q. For the full year, the rise in benefit costs moderated substantially to 4.1% from the peak 7.1% increase during 2004. Benefit costs in manufacturing rose 1.3% (4.9% y/y). The yearly increase compared to a 10.1% rise during 2004.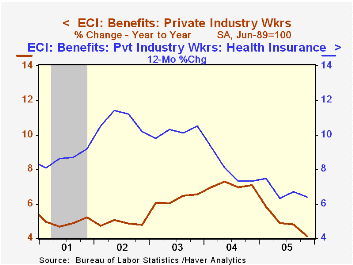
The cost of health benefits rose 6.4% y/y and for the year was the slowest rate on increase since 1999.
Wage and salary growth continued at 0.6% for the fourth straight quarter. The annual gain of 2.5% about equaled 2004 but was down sharply from the 4.0% increase during 1997. Wages account for roughly 70% of the compensation index.
Gauging the Size of Today's Price Shocks from the Federal Reserve Bank of St. Louis is available here.
| ECI- Private Industry Workers | 4Q '05 | 3Q '05 | Y/Y | 2005 | 2004 | 2003 |
|---|---|---|---|---|---|---|
| Compensation | 0.8% | 0.8% | 2.8% | 2.8% | 3.9% | 4.2% |
| Wages & Salaries | 0.6% | 0.6% | 2.5% | 2.5% | 2.4% | 3.0% |
| Benefit Costs | 0.9% | 1.3% | 4.1% | 4.1% | 7.1% | 6.6% |
by Tom Moeller January 31, 2006
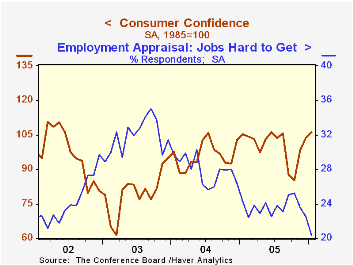
The Index of Consumer Confidence, as measured by the Conference Board, rose 2.4% to 106.3 during January. This third consecutive monthly increase exceeded Consensus expectations for a lesser gain to 105.0. The increase was in line with the 2.1% m/m (-2.2% y/y) rise in Consumer Sentiment reported last week by the University of Michigan.
During the last twenty years there has been a 52% correlation between the level of consumer confidence and the y/y change in real consumer spending. The correlation rose to 66% during the last ten years.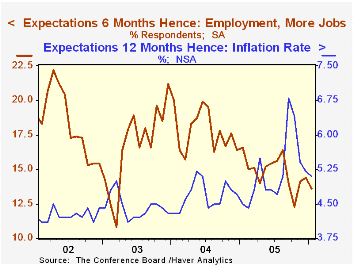
Consumers' assessment of the present situation added 6.4% (14.5% y/y) to a revised 6.6% December increase. Jobs were viewed as plentiful by 26.9% of respondents, a sharp increase from December and the highest since September, 2001. Fewer (20.3%) thought jobs were hard to get, also the lowest since 2001.
The index of consumers' expectations dipped slightly month to month (-8.9% y/y). Fewer expected better business conditions in six months and fewer expected that there would be more jobs.
Inflation in twelve months was expected at a 5.1% rate, down slightly from the 5.2% expected in December and down sharply from the 6.8% expected last September.
The Conference Board’s survey isconducted by a mailed questionnaire to 5,000 households and about 3,500 typically respond.
| Conference Board | Jan | Dec | Y/Y | 2005 | 2004 | 2003 |
|---|---|---|---|---|---|---|
| Consumer Confidence | 106.3 | 103.8 | 1.1% | 100.3 | 96.1 | 79.8 |
by Tom Moeller January 31, 2006
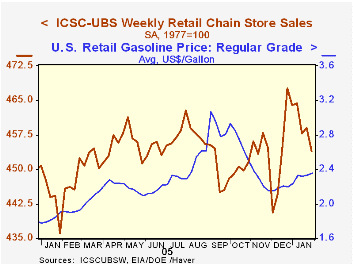
Chain store sales fell a hard 1.1% last week after the modest 0.3% rise during the prior period, according to the International Council of Shopping Centers (ICSC)-UBS survey.
The drop lowered the gain in sales during January to 1.0% versus December.
Last week, gasoline prices at the pump rose two cents to $2.36 per gallon of regular unleaded. The January average rose to $2.32 but yesterday, in spot market trading, gasoline rose to $1.74 and that has been the spot market average during January, up 27 cents from November.
The leading indicator of chain store sales rose 0.5% and pulled the January average 1.3% ahead of December which rose 0.8%.The ICSC-UBS retail chain-store sales index is constructed using the same-store sales (stores open for one year) reported by 78 stores of seven retailers: Dayton Hudson, Federated, Kmart, May, J.C. Penney, Sears and Wal-Mart.
| ICSC-UBS (SA, 1977=100) | 01/28/06 | 01/21/06 | Y/Y | 2005 | 2004 | 2003 |
|---|---|---|---|---|---|---|
| Total Weekly Chain Store Sales | 454.0 | 459.0 | 4.1% | 3.6% | 4.7% | 2.9% |
by Louise Curley January 31, 2006
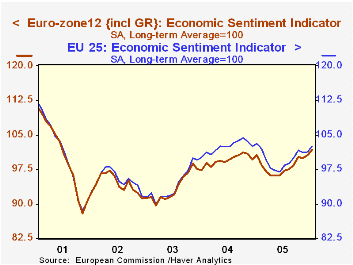
Economic sentiment in the European Union, and particularly the Euro Zone is improving. The Business Climate Indicator (long-term average = 100) for the individual countries of the European Union, together with the aggregates for the EU (25) and for the Euro Zone (12) were released today by the Directorate General for Economic and Financial Affairs of the European Commission. In addition, the results of surveys of the manufacturing, retail, service and construction industries and of consumer confidence were released.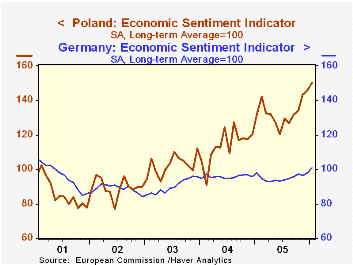
The Business Climate Indicator for the EU(25) as a whole has generally been better than in the smaller subset, the Euro Zone, as shown in the first chart. The better sentiment in the EU as a whole may be due, in part to the inclusion of the emerging central and eastern countries where recent growth prospects have been stronger than those in the west. But there are faint signs that sentiment in the Euro Zone may be improving faster. The sentiment indicator for the EU was 102.6 in January, an increase of 1.28 % from December, but 0.48% below January of 2005. The indicator for the Euro Zone was 101.8 up, 1.19% from December but, significantly, 1.29% above January 2005. The Index for the Euro Zone is now at its highest level since June 2001.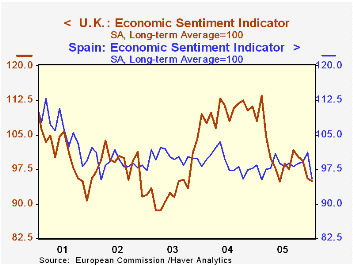
Among the countries showing an improved business climate were Germany, Italy and Poland. We've charted the business climate indicators for a Euro Zone and a Non Euro Zone country--Germany and Poland--in the second chart. Germany's muted rise contrasts with the dynamic rise that has taken place in Poland over the past three years. Another Euro Zone and Non Euro Zone comparison is shown in chart 3 where the business climate indicators for Spain and the United Kingdom are compared.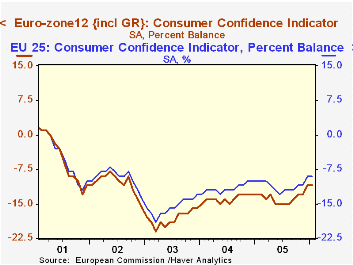 After rising sharply in late 2003 the indicator for the UK plunged in early 2005 and has yet to show significant improvement. The course of the business climate indicator for Spain has been less dramatic, but shows a definite waning of business sentiment.
Similar to the comparison between the business climate indicator for the EU and the Euro Zone, the comparison of the consumer confidence indicators shown in the fourth chart suggests some slight improvement in consumer confidence in the Euro Zone relative to the EU as a whole.
| Economic Sentiment Indicator (Long term average = 100) |
Jan 06 | Dec 05 | Jan 05 | M/M % | Y/Y % | 2005 | 2004 | 2003 |
|---|---|---|---|---|---|---|---|---|
| European Union (25) | 102.6 | 101.2 | 103.1 | 1.28 | -0.48 | 99.8 | 102.4 | 94.1 |
| Euro Zone (12) | 101.8 | 100.6 | 100.5 | 1.19 | 1.29 | 98.2 | 99.5 | 93.5 |
| Germany | 100.9 | 98.1 | 98.0 | 2.85 | 2.96 | 95.2 | 95.8 | 90.2 |
| Poland | 150.1 | 145.8 | 131.9 | 2.95 | 13.80 | 133.1 | 113.6 | 102.5 |
| Spain | 95.4 | 101.1 | 98.4 | -5.64 | -3.05 | 98.5 | 99.0 | 100.1 |
| United Kingdom | 95.0 | 95.5 | 108.0 | -0.52 | -12.04 | 101.0 | 110.2 | 93.8 |
| Percent Balance | Jan 06 | Dec 05 | Jan 05 | M/M dif | Y/Y dif | 2005 | 2004 | 2003 |
| Consumer Confidence (25) | -9 | -9 | -10 | 0 | 1 | -11 | -12 | -16 |
| Consumer Confidence (12) | -11 | -11 | -13 | 0 | 2 | -14 | -14 | -18 |

Tom Moeller
AuthorMore in Author Profile »Prior to joining Haver Analytics in 2000, Mr. Moeller worked as the Economist at Chancellor Capital Management from 1985 to 1999. There, he developed comprehensive economic forecasts and interpreted economic data for equity and fixed income portfolio managers. Also at Chancellor, Mr. Moeller worked as an equity analyst and was responsible for researching and rating companies in the economically sensitive automobile and housing industries for investment in Chancellor’s equity portfolio. Prior to joining Chancellor, Mr. Moeller was an Economist at Citibank from 1979 to 1984. He also analyzed pricing behavior in the metals industry for the Council on Wage and Price Stability in Washington, D.C. In 1999, Mr. Moeller received the award for most accurate forecast from the Forecasters' Club of New York. From 1990 to 1992 he was President of the New York Association for Business Economists. Mr. Moeller earned an M.B.A. in Finance from Fordham University, where he graduated in 1987. He holds a Bachelor of Arts in Economics from George Washington University.
More Economy in Brief


