 Global| Jun 13 2007
Export and Import Prices Trends Show Growing Pressure
Summary
Even for the consumer where excluding food and energy trends have been mild and are not accelerating much of the acceleration in international prices is still there and quite clear. The chart on the left applies consumer price weights [...]
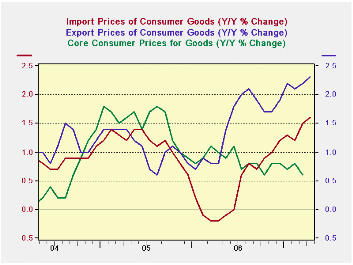
Even for the consumer where excluding food and energy trends have been mild and are not accelerating much of the acceleration in international prices is still there and quite clear. The chart on the left applies consumer price weights from nonfood consumer goods spending and applies them to export and import prices for vehicles and (nonfood) consumer goods to collapse consumer goods and vehicles into one measure. For both exports and imports these series show rising inflation tendencies. Even though the topography of the chart may seem shocking the scale is low to the acceleration in exports of consumer prices is up by just a percentage point since mid-2005, a period of nearly 2 years. For imports the acceleration is about 1.8 percentage points from its low over the past year. But that acceleration brings the inflation rate UP TO only 1.6% Y/Y for ‘total’ consumer goods imports. Moreover that pace is not accelerating when looked at on shorter horizons such as the past three months or six months (see table below for consumer goods prices on imports and vehicle prices for imports).
We plot core consumer prices for goods on this same graph to show that export/import trends do not quickly or fully get into US consumer prices. Core goods consumer prices in fact are still in a slight DOWNTREND during this episode of export/import price inflation based on these constructed core export and import consumer price measures.
Overall export and import prices show accelerating trends based on the price movements of the energy component (embedded in industrial supplies). In contrast, capital goods prices show weakness. This is a bit of a concern since price weakness is often a sign of demand weakness (especially when commodity prices are not driving the result, as they would not be for capital goods). Since the main US export strength is in capital goods this could be an issue of adversity for US exporters. Weakening price for capital goods imports may also suggest weak capital spending domestically, although there were some signs of that picking up. By and large, the dollar weakness does not appear to have played much of a role for export and import prices although export prices are rising a bit faster than import prices as we might expect when the dollar is weak.
In part these results reflect that the dollar is weak Vs the Euro but it has (just) hit a 4 ½ year high Vs the yen and its drop Vs the Chinese yuan is ever so slow. Export and import prices trends reflect these glacial movements amid cross currents. Beyond these short trends (3-month, 6-month) the big picture still shows that export and import prices are rising as Y/Y inflation is getting a bit worse. But the rate of change is not a great worry for US policymakers; although it comes at time when their inflation fighting hackles are up, it is a trend that is moving in the WRONG direction.
| M/MO | Saar | |||||
| IMPORTS | Apr-07 | Mar-07 | Feb-07 | 3-Mo | 6-Mo | 12-Mo |
| ALL Imports | 1.3% | 1.5% | 0.4% | 13.3% | 7.2% | 1.9% |
| Excl Petrol | 0.2% | 0.3% | 0.0% | 1.9% | 3.7% | 2.9% |
| Petrol | 6.5% | 8.1% | 1.7% | 87.7% | 25.1% | -1.8% |
| Foods, Feeds and Beverages | 1.4% | -0.2% | 0.2% | 6.2% | 8.9% | 8.8% |
| Industrial Supplies | 3.7% | 4.5% | 1.0% | 43.6% | 19.9% | 3.2% |
| Capital goods | -0.4% | -0.2% | -0.3% | -3.9% | -1.5% | -0.4% |
| Motor Vehicles & Parts | 0.0% | 0.1% | 0.1% | 0.8% | 0.4% | 0.9% |
| Consumer Goods excl Autos | 0.1% | 0.1% | 0.0% | 0.8% | 1.6% | 1.9% |
| M/MO | Saar | |||||
| EXPORTS | Apr-07 | Mar-07 | Feb-07 | 3-Mo | 6-Mo | 12-Mo |
| ALL Exports | 0.3% | 0.6% | 0.8% | 7.3% | 6.6% | 4.9% |
| Agriculture | -1.3% | 2.0% | 2.8% | 15.0% | 24.0% | 19.0% |
| Non Agriculture | 0.4% | 0.5% | 0.6% | 6.6% | 5.3% | 3.9% |
| Foods, Feeds and Beverages | -0.8% | 2.3% | 3.2% | 20.1% | 24.9% | 20.2% |
| Industrial Supplies | 1.3% | 1.7% | 2.0% | 22.2% | 15.4% | 10.2% |
| Capital goods | -0.1% | -0.1% | 0.0% | -0.8% | 0.4% | 0.5% |
| Motor Vehicles & Parts | 0.1% | 0.1% | 0.1% | 1.1% | 1.3% | 1.3% |
| Consumer Goods excl Autos | 0.5% | 0.0% | 0.0% | 1.9% | 2.7% | 2.6% |

Robert Brusca
AuthorMore in Author Profile »Robert A. Brusca is Chief Economist of Fact and Opinion Economics, a consulting firm he founded in Manhattan. He has been an economist on Wall Street for over 25 years. He has visited central banking and large institutional clients in over 30 countries in his career as an economist. Mr. Brusca was a Divisional Research Chief at the Federal Reserve Bank of NY (Chief of the International Financial markets Division), a Fed Watcher at Irving Trust and Chief Economist at Nikko Securities International. He is widely quoted and appears in various media. Mr. Brusca holds an MA and Ph.D. in economics from Michigan State University and a BA in Economics from the University of Michigan. His research pursues his strong interests in non aligned policy economics as well as international economics. FAO Economics’ research targets investors to assist them in making better investment decisions in stocks, bonds and in a variety of international assets. The company does not manage money and has no conflicts in giving economic advice.
More Economy in Brief


