 Global| Sep 11 2009
Export and Import Prices Pop But Ex-Oil Import Prices Barely Budge
Summary
US export and import prices remained tame in August. Headline prices shot up as oil prices scored double-digit gains in the month. For exports the headline rise was spurred by industrial supplies and the US does export some oil. [...]
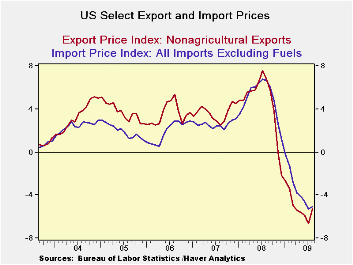
US export and import prices remained tame in August. Headline
prices shot up as oil prices scored double-digit gains in the month.
For exports the headline rise was spurred by industrial supplies and
the US does export some oil. Agricultural export prices were tame.
Export prices excluding agriculture rose by a sharp 0.8%. Import prices
excluding petroleum rose by 0.4% (after a 0.3% drop in July). The
headline price gains were more ominous-looking with an import prices up
by 2% and export prices gaining 0.7%
If you look up and down the export and import categories you
see tempered price trends with the exception of petroleum prices and
industrial supplies, the category that contains industrial supplies.
The US is not importing any inflation. This is just another
example of how weak the global economies still are. The dollar has been
weaker and oil prices have been rising but inflation is not getting any
traction.
| Export and Import Prices | |||||||
|---|---|---|---|---|---|---|---|
| M/MO | Saar | ||||||
| IMPORTS | Aug-09 | Jul-09 | Jun-09 | 3-MO | 6-MO | 12-MO | |
| ALL Imports | 2.0% | -0.7% | 2.7% | 17.5% | 15.8% | -15.0% | |
| Excl Petrol | 0.4% | -0.3% | 0.2% | 1.1% | -1.1% | -6.5% | |
| Petrol | 10.5% | -2.6% | 17.2% | 152.5% | 193.7% | -38.1% | |
| Foods Feeds and Beverages | 1.7% | -1.0% | 0.4% | 4.7% | 4.4% | -6.4% | |
| Industrial Supplies | 6.1% | -1.8% | 8.8% | 65.6% | 62.8% | -31.7% | |
| Capital goods | 0.1% | 0.0% | 0.0% | 0.4% | -0.6% | -1.5% | |
| Motor Vehicles & parts | 0.2% | 0.1% | 0.1% | 1.5% | 0.7% | 0.0% | |
| Consumer goods excl autos | -0.2% | -0.2% | 0.1% | -1.1% | -1.0% | -1.2% | |
| M/MO | Saar | ||||||
| EXPORTS | Aug-09 | Jul-09 | Jun-09 | 3-MO | 6-MO | 12-MO | |
| ALL Exports | 0.7% | -0.3% | 1.0% | 5.6% | 3.3% | -6.1% | |
| Agriculture | 0.2% | -4.9% | 4.2% | -2.7% | 6.1% | -14.1% | |
| Non Agriculture | 0.8% | 0.1% | 0.6% | 6.1% | 3.2% | -5.3% | |
| Food Feeds and Beverages | -0.1% | -5.6% | 4.4% | -5.6% | 3.5% | -13.0% | |
| Industrial Supplies | 2.3% | 0.0% | 2.0% | 18.3% | 8.4% | -17.5% | |
| Capital Goods | 0.1% | 0.3% | 0.1% | 2.0% | 2.4% | 1.6% | |
| Motor Vehicles & Parts | 0.1% | -0.2% | -0.1% | -0.7% | -0.4% | 0.1% | |
| Consumer goods excl autos | 0.3% | 0.4% | 0.4% | 4.1% | -0.5% | 0.0% | |

Robert Brusca
AuthorMore in Author Profile »Robert A. Brusca is Chief Economist of Fact and Opinion Economics, a consulting firm he founded in Manhattan. He has been an economist on Wall Street for over 25 years. He has visited central banking and large institutional clients in over 30 countries in his career as an economist. Mr. Brusca was a Divisional Research Chief at the Federal Reserve Bank of NY (Chief of the International Financial markets Division), a Fed Watcher at Irving Trust and Chief Economist at Nikko Securities International. He is widely quoted and appears in various media. Mr. Brusca holds an MA and Ph.D. in economics from Michigan State University and a BA in Economics from the University of Michigan. His research pursues his strong interests in non aligned policy economics as well as international economics. FAO Economics’ research targets investors to assist them in making better investment decisions in stocks, bonds and in a variety of international assets. The company does not manage money and has no conflicts in giving economic advice.
More Economy in Brief


