 Global| Jun 25 2007
Existing Home Sales Edge Lower by 0.3% - Two of Four Regions Drop
Summary
The monthly series of existing housing sales continues to show weakness but it also shows that weakness has been diminishing. On the left we plot a three-month moving average of year/year growth rates. It shows that all regions except [...]
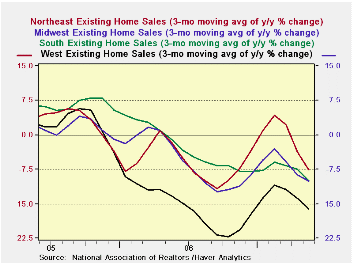
The monthly series of existing housing sales continues to show weakness but it also shows that weakness has been diminishing. On the left we plot a three-month moving average of year/year growth rates. It shows that all regions except the SOUTH have put their period of biggest declines behind them. The South, with ongoing problems in the Gulf region, continues to show some of the nation’s worst housing trends. Each region has experienced a rebound then another episode of weakness. The question is whether this new episode of weakness will remain muted or gather momentum. The raw monthly patterns look more like regions that are losing their weakness. The final stage of recovery for housing will be for the various regions to have some month/month increases and for growth rates to move sideways and eventually higher.
From roughly December 2005 through September 2006 housing was in its worst period of this cycle across regions. Since then three of four regions are looking like they are trying to stabilize.
Prices have been recovering too but that is a seasonal trend. Median housing prices are down 2.1% Yr/Yr and average prices are lower by just 0.8%.
The smaller regions rebounded this month while the two larger regions continued to slow.
The progressive growth rates do not show a particular pattern except that over six months the pace of slowing was cut back or even became an increase but then turned to a larger decline in the recent three months. Charts on the levels of variables give us better guidance on where trends are going and those actually look more stable than charts constructed from growth rates.
Moreover prices are not accelerating their drop. In the Midwest Yr/Yr median prices fell for 11 straight months and now have risen in two of the past three months. Overall median prices are still dropping and are lower in 10 straight months.
The large Southern region of the county, beset by problems in the Gulf states, has the largest Yr/Yr drop in existing home prices at 3.3% It has seen a 10-month string of monthly declines in Yr/Yr average and median prices. It is helping to drive the weakness in US overall prices. Even the West that remains weak has seen average prices rise Yr/Yr in half of the months dating back to June 2006. Median prices in the West are weaker having last risen Yr/Yr in February 2007.
The number of homes for sales actually rose last month pushing the number of months supply up to 8.9 months from 8.4 previously and from as low as 6.4 months one year ago. We do not place much stock in these figures for existing homes since by and large these are owner occupied homes and are not being sold by a business. The fact that prices are not plunging as supply increases suggests that there is a somewhat better balance in the market than what the homes-for-sale data suggest. Indeed, own-home sellers face far different market forces than builders selling empty new homes.
We are left with the feeling that regional events are getting in the way of these national comparisons. Hurricanes that battered the Gulf states and overbuilding in places like Florida and Las Vegas are having outsized impact on the data. Even so we can see that housing prices are, by and large, stabilizing and that, while existing home sales are still declining, the pace of decline is being contained and is not accelerating.
| (Existing Home Sales: In Thousands' -- Nat'n'l Ass'n of Realtors) | |||||
| Month | Total | North-East | Mid-West | South | West |
| May.07 | 5,990 | 1100 | 1410 | 2300 | 1180 |
| Apr.07 | 6,010 | 1040 | 1400 | 2380 | 1190 |
| Mar.07 | 6,150 | 1140 | 1390 | 2410 | 1210 |
| Feb.07 | 6,680 | 1220 | 1560 | 2570 | 1320 |
| Jan.07 | 6,440 | 1060 | 1520 | 2540 | 1320 |
| Dec.06 | 6,270 | 1070 | 1460 | 2490 | 1250 |
| Nov.06 | 6,250 | 1080 | 1420 | 2470 | 1280 |
| Oct.06 | 6,270 | 1030 | 1420 | 2520 | 1300 |
| Sep.06 | 6,230 | 1040 | 1420 | 2520 | 1260 |
| Aug.06 | 6,310 | 1060 | 1430 | 2520 | 1290 |
| Jul.06 | 6,320 | 1050 | 1430 | 2530 | 1320 |
| Jun.06 | 6,490 | 1090 | 1490 | 2550 | 1360 |
| May.06 | 6,680 | 1140 | 1510 | 2610 | 1410 |
| Percent Changes: Existing Home Sales | |||||
| Mo/Mo% | Total | North-East | Mid-West | South | West |
| May.07 | -0.3% | 5.8% | 0.7% | -3.4% | -0.8% |
| Apr.07 | -2.3% | -8.8% | 0.7% | -1.2% | -1.7% |
| Mar.07 | -7.9% | -6.6% | -10.9% | -6.2% | -8.3% |
| Feb.07 | 3.7% | 15.1% | 2.6% | 1.2% | 0.0% |
| 3-Mo:ar | -41.3% | -39.3% | -38.5% | -42.0% | -42.4% |
| 6-mo:ar | -8.3% | 3.7% | -1.4% | -13.8% | -15.6% |
| 1-Year | -10.3% | -3.5% | -6.6% | -11.9% | -16.3% |
| Prices: | Median Prices | ||||
| One Mo: | 1.8% | -0.1% | 2.9% | 2.3% | -0.4% |
| One Year: | -2.1% | 0.5% | -1.7% | -3.8% | -0.5% |
by Louise Curley June 25, 2007
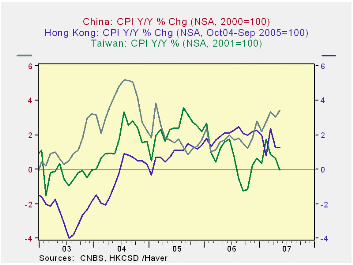
Consumer Price Indexes for four countries--China, India, Singapore and Vietnam--were released today and can be found in the Haver Data Base. EMERGEPR, together with similar data for other Asian nations. Data are available, through May, except for India.
Inflation, as measured by the year to year increase in the Consumer Price Index, has varied widely in the various countries of Asia. Inflation in the first five months of this year are shown for selected Asian countries in the table below, together with the annual rates for 2004, 2005 and 2006.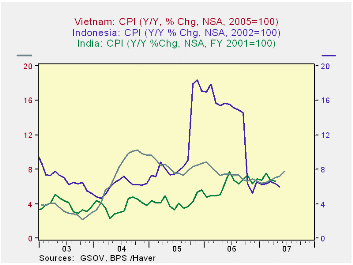
Deflationary tendencies that were evident in the Greater China Area appear to have lessened in Hong Kong and China, but still persist in Taiwan. These trends are shown in the first chart.
Among the high inflation countries, Vietnam, Indonesia and India, for example, inflation in Vietnam after decelerating somewhat last year has increased in the current months of this year. Inflation in India has trended upward since mid 2005. Inflation in Indonesia jumped in late 2005 as a result of natural disasters and fell precipitately in late 2006. Inflation there is now moderately below the levels reached in early 2005 and no clear trend is apparent, as can be seen in the second chart.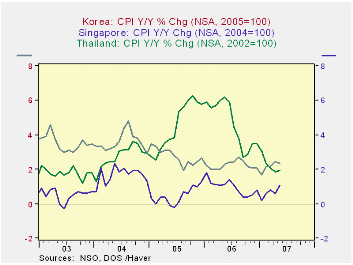
The third chart shows the course of inflation in countries that have experienced moderating inflation in recent years. Thailand, like Indonesia experienced exceptionally high inflation in late 2005 and early 2006 followed by a sharp fall later in the year. Among these countries inflation in Singapore and, to a lesser extent, in South Korea is trending upward.
| INFLATION IN ASIA Y/Y % CHANGE IN CPI | May 07 | Apr 07 | Mar 07 | Feb 07 | Jan 07 | 2006 | 2005 | 2004 |
|---|---|---|---|---|---|---|---|---|
| China | 3.42 | 3.05 | 3.33 | 2.75 | 2.21 | 1.71 | 1.78 | 3.78 |
| Hong Kong | 1.27 | 1.27 | 2.36 | 0.79 | 1.97 | 2.02 | 0.91 | -0.38 |
| Taiwan | -0.03 | 0.67 | 0.84 | 1.74 | 0.35 | 0.60 | 2.31 | 1.61 |
| Vietnam | 7.22 | 7.07 | 6.70 | 6.48 | 6.43 | 7.39 | 8.28 | 7.76 |
| Indonesia | 6.01 | 6.29 | 6.22 | 6.30 | 6.26 | 13.10 | 10.46 | 6.06 |
| India | n.a. | 6.67 | 6.72 | 7.56 | 6.72 | 6.18 | 4.24 | 3.77 |
| South Korea | 2.35 | 2.45 | 2.16 | 2.17 | 1.68 | 2.24 | 2.75 | 3.59 |
| Singapore | 1.09 | 0.59 | 0.79 | 0.59 | 0.20 | 0.96 | 0.47 | 1.67 |
| Thailand | 1.91 | 1.84 | 2.04 | 2.32 | 3.05 | 4.64 | 4.54 | 2.77 |
Robert Brusca
AuthorMore in Author Profile »Robert A. Brusca is Chief Economist of Fact and Opinion Economics, a consulting firm he founded in Manhattan. He has been an economist on Wall Street for over 25 years. He has visited central banking and large institutional clients in over 30 countries in his career as an economist. Mr. Brusca was a Divisional Research Chief at the Federal Reserve Bank of NY (Chief of the International Financial markets Division), a Fed Watcher at Irving Trust and Chief Economist at Nikko Securities International. He is widely quoted and appears in various media. Mr. Brusca holds an MA and Ph.D. in economics from Michigan State University and a BA in Economics from the University of Michigan. His research pursues his strong interests in non aligned policy economics as well as international economics. FAO Economics’ research targets investors to assist them in making better investment decisions in stocks, bonds and in a variety of international assets. The company does not manage money and has no conflicts in giving economic advice.


