 Global| Jun 17 2021
European Car Registrations Decline for the Second Month in a Row, But Show Massive Strength over 12 Months on the [...]
Summary
The data and the statistics in the table may not be so clear. But this month the plot of vehicle registrations in their raw form - not as percentage changes- shows exactly what is going on. The answer is that 'less and less' is what's [...]
The data and the statistics in the table may not be so clear. But this month the plot of vehicle registrations in their raw form - not as percentage changes- shows exactly what is going on.
The answer is that 'less and less' is what's going on.
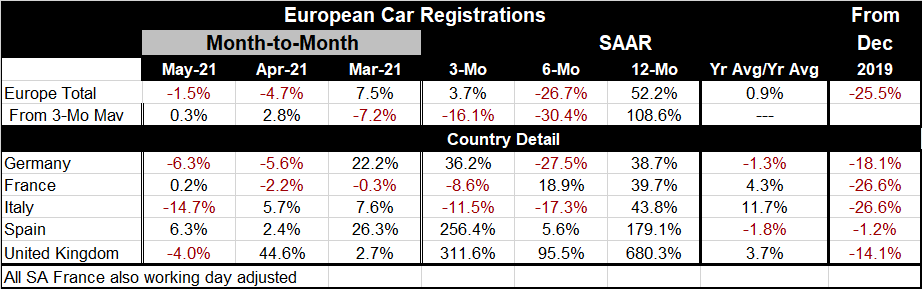
The statistics in the table are somewhat convoluted. The patterns are idiosyncratic across countries and the percent changes on sequential periods give no clue as to what is really going on. The usual framework of looking at the three-month, six-month, and 12-month percentage changes simply is a nonstarter. The 12-month change this month is off a depressed calculation base that does not reveal the true trend.
 A picture is worth a thousand words…especially here
The chart shows the true trend and it is also a complicated one. Positioning the exact correct trend is still not a piece of cake. It is not so clear exactly what that trend is, but it is clear which way it points. The trend is lower and despite several peaks in sales since 2018, the peak-to-peak trend as well as the trough-to-trough trend (that excludes the deep Covid dip) both point lower (these are sketched onto the graph).
The Covid dip is the phenomenon that fouls up the calculations. April of last year was the Covid low, but in May registrations were still weak. They were so weak that registrations doubled over the next two months. So, of course the year-on-year calculation shows exaggerated strength. And we know that activity is up enormously from the Covid low, but that really says nothing about where sales are compared to trend. In this environment, the 12-month change is nowhere near being the trend.
To assist in understanding the data, I have added a column to the usual monthly table that looks at the current sales compared to sales in December 2019 before the virus struck. On that comparison, we see a decline in registrations of 25.5% overall and country-by-country declines that range from -26.6% to -1.2%. Spain shows the smallest net drop on this comparison, but all of the countries in the table show the same general pattern of weakening from about 2018 onward despite considerable oscillation over the period.
The table also calculates a super-smoothed result. It looks at the percent change in registrations over 12 months using the 12-month average over the previous 12-month average of 12-months ago. This calculation spans 24-months. This metric finds sales higher by 0.9% with German and Spanish sales net lower on this comparison while U.K., French and Italian sales are net higher.
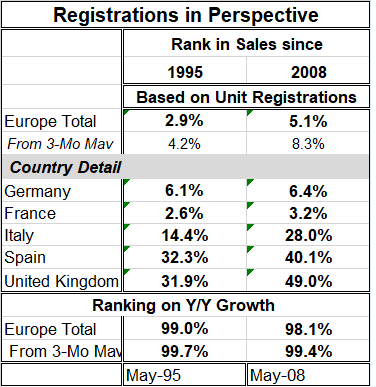 A second table reveals more about what lies behind the data. The top panel of the table ranks this month's pace of sales based on the raw unit registration rate. Ranked on data back to 1995, the May 2021 level of registrations stands in the lower 2.9% of all such data, while it stands a bit stronger at the 5.1 percentile on data back to 2008. Smoothing the data and ranking by three-month averages lifts these two metrics only slightly. The clear lesson from the ranking exercise is also the right one that the pace of registrations is weak, and this is despite the strong rebound from the Covid weakness of 2020.
The second panel in the table shows sales rankings for the individual countries also using unit registrations. The country rankings are mixed but weak with all of them on any timeline below their historic medians (below a ranking of 50%). In the bottom panel, the total European rankings are recast in a framework that ranks year-on-year sales percentage changes. Because of the huge boost sales are currently getting from the weak Covid base, ranking the May sales on a percentage gain basis yields top 1% or top 2% rankings across all timelines for total or smoothed aggregate data.
The difference between looking at unit sales (top panel) and percentage changes (bottom panel) is like night and day.
Clearly Europe's vehicle sector is struggling. The Great Recession knocked the starch out of the sector then a long recovery was hit by an emissions standards cheating scandal that pushed sales lower again. After a partial rebound Covid struck and pushed sales down yet again. Through all of these disruptions sales have gotten whacked and then recovered but consistently made less than full recoveries leaving a withering trend in place. And that is where the European auto sector still stands.

Robert Brusca
AuthorMore in Author Profile »Robert A. Brusca is Chief Economist of Fact and Opinion Economics, a consulting firm he founded in Manhattan. He has been an economist on Wall Street for over 25 years. He has visited central banking and large institutional clients in over 30 countries in his career as an economist. Mr. Brusca was a Divisional Research Chief at the Federal Reserve Bank of NY (Chief of the International Financial markets Division), a Fed Watcher at Irving Trust and Chief Economist at Nikko Securities International. He is widely quoted and appears in various media. Mr. Brusca holds an MA and Ph.D. in economics from Michigan State University and a BA in Economics from the University of Michigan. His research pursues his strong interests in non aligned policy economics as well as international economics. FAO Economics’ research targets investors to assist them in making better investment decisions in stocks, bonds and in a variety of international assets. The company does not manage money and has no conflicts in giving economic advice.
More Economy in Brief


