 Global| Aug 22 2008
Euro Orders Continue to Plunge
Summary
Euro orders fell again in June by less month-to-month than in May but drove the Yr/Yr drop to -7.4%. That is much deeper than the -1.8% Y/Y drop recorded in May. Domestic orders in the zone are down Yr/Yr but are still struggling to [...]
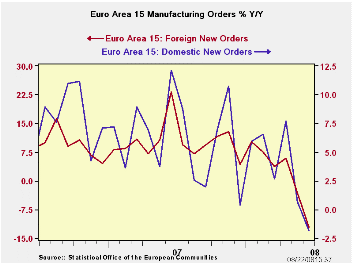
Euro orders fell again in June by less month-to-month than in May but drove the Yr/Yr drop to -7.4%. That is much deeper than the -1.8% Y/Y drop recorded in May. Domestic orders in the zone are down Yr/Yr but are still struggling to show growth over 3 months and 6 months. But foreign orders are weak and weakening. Foreign orders are down at a very sharp 20.2% annual rate over the most recent three months compared to falling by 12.1% Yr/Yr.
By comparison sales are still growing in the zone and are growing for consumer goods Capital goods and intermediate goods on most horizons. Still sales growth shows signs of slowing. With the declines in orders we expect to see clearer weakness in sales in coming months.
The county level adapt are peculiar. Germany shows a clear trend of progressive deterioration in orders. For France orders growth is becoming less weak over the shorter horizons, indicating improvement. That trend is not credible given the weak French industrial data we have seen. In the UK orders have surged strongly in the past three months even as UK GDP has gone flat. The overall EMU data tell a much clearer story of trends. The country level data appear to be unstable and the country level contrary data are not particularly compelling. Europe is weakening. The country level should fall into line on this theme in the coming months.
| Euro Area and UK Industrial Orders & Sales Trends | |||||||||
|---|---|---|---|---|---|---|---|---|---|
| Saar except m/m | % m/m | Jun 08 |
Jun 08 |
Jun 08 |
Jun 07 |
Jun 06 |
Qtr-2 -Date |
||
| Euro Area Detail | Jun 08 |
May 08 |
Apr 08 |
3Mo | 6mo | 12mo | 12mo | 12mo | Saar |
| MFG Sales | 0.4% | 0.3% | 0.3% | 4.2% | 7.1% | 4.4% | 6.9% | 7.7% | 4.1% |
| Consumer | 0.1% | 0.1% | 0.0% | 0.9% | 0.8% | 1.7% | 6.9% | 7.7% | 0.5% |
| Capital | 0.3% | 0.2% | 0.2% | 3.0% | 4.8% | 4.7% | 4.5% | 4.0% | 3.5% |
| Intermediate | 0.7% | -5.2% | 4.7% | 0.2% | 1.9% | -1.8% | 8.5% | 6.9% | 1.0% |
| MFG Orders | |||||||||
| Total Orders | -0.3% | -5.3% | 3.6% | -8.6% | -2.3% | -7.4% | 17.3% | 6.4% | -6.0% |
| EA 15 Domestic MFG orders | 0.7% | -5.2% | 4.7% | 0.2% | 1.9% | -1.8% | 12.2% | 4.5% | 1.0% |
| EA 15 Foreign MFG orders | -0.7% | -4.8% | 0.0% | -20.2% | -7.4% | -12.1% | 23.2% | 8.5% | -15.7% |
| Countries: | Jun 08 |
May 08 |
Apr 08 |
3Mo | 6mo | 12mo | 12mo | 12mo | Qtr-2 -Date |
| Germany | -3.1% | -1.4% | -1.0% | -19.9% | -12.1% | -7.6% | 18.5% | 9.6% | -13.4% |
| France | 0.1% | -6.3% | 5.9% | -2.5% | -4.0% | -13.7% | 19.3% | 3.4% | -11.3% |
| Italy | #N/A | -3.1% | 0.5% | #N/A | #N/A | #N/A | 10.7% | 10.1% | #N/A |
| UK (EU) | -2.4% | -8.1% | 20.6% | 37.0% | 2.5% | 2.8% | 1.4% | 8.1% | -5.5% |
by Robert Brusca August 22, 2008
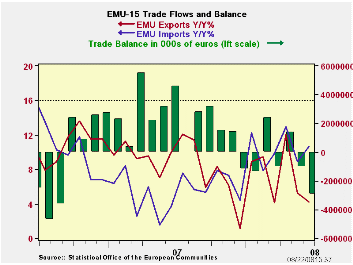
Import growth in the Euro Area is still firm while export growth is fading. Import growth is of course is supported by strength in oil imports, much of that on the price side. For manufactured goods both exports and imports are weak over 12 months with imports falling by 1.8% and exports up by a scant 0.8%.
The accompanying chart tells the story of the trends with trade deficits posted in five of the past seven months. Europe is slowing down. Europe’s exports are slowing down. It’s a strong euro, weak domestic growth and a weakening global economy at work that is producing these results.
| Euro Area 15-Trade Trends for Goods | ||||||
|---|---|---|---|---|---|---|
| m/m% | % Saar | |||||
| Jun-08 | May-08 | 3M | 6M | 12M | 12M Ago | |
| Balance* | €€ (2,954) | €€ (1,035) | €€ (861) | €€ (440) | €€ 1,543 | €€ (1,610) |
| Exports | ||||||
| All exports | 1.4% | -4.7% | 8.5% | 11.3% | 4.2% | 10.1% |
| Food and drinks | -0.4% | -0.7% | 8.5% | 13.5% | 9.5% | 11.4% |
| Raw materials | 2.4% | -1.1% | 23.4% | 31.3% | 10.4% | 11.1% |
| Other | 1.5% | -5.1% | 8.2% | 10.7% | 3.7% | 9.9% |
| MFG | 1.1% | -3.8% | 6.9% | 11.2% | 0.8% | 13.3% |
| Imports | ||||||
| All imports | 2.9% | -3.0% | 14.8% | 14.1% | 10.6% | 3.8% |
| Food and drinks | 0.6% | 0.2% | 7.9% | -2.1% | 8.3% | 7.4% |
| Raw materials | -1.1% | 1.2% | 1.2% | 6.7% | 2.3% | 15.5% |
| Other | 3.2% | -3.3% | 16.0% | 15.6% | 11.2% | 3.0% |
| MFG | 0.3% | -1.3% | -0.3% | 3.8% | -1.7% | 9.9% |
| *Millions of Euros; mo or period average | ||||||

Robert Brusca
AuthorMore in Author Profile »Robert A. Brusca is Chief Economist of Fact and Opinion Economics, a consulting firm he founded in Manhattan. He has been an economist on Wall Street for over 25 years. He has visited central banking and large institutional clients in over 30 countries in his career as an economist. Mr. Brusca was a Divisional Research Chief at the Federal Reserve Bank of NY (Chief of the International Financial markets Division), a Fed Watcher at Irving Trust and Chief Economist at Nikko Securities International. He is widely quoted and appears in various media. Mr. Brusca holds an MA and Ph.D. in economics from Michigan State University and a BA in Economics from the University of Michigan. His research pursues his strong interests in non aligned policy economics as well as international economics. FAO Economics’ research targets investors to assist them in making better investment decisions in stocks, bonds and in a variety of international assets. The company does not manage money and has no conflicts in giving economic advice.
More Economy in Brief


