 Global| Nov 06 2012
Euro Area Woes Affecting German Manufacturing Outlook
Summary
German manufacturing is beginning to be seriously affected by the slow downs in other euro area countries. German Manufacturing and Mining Sales declined 2.9% in September from August and were 2.5% below September of a year ago. New [...]
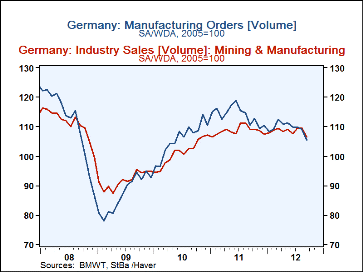
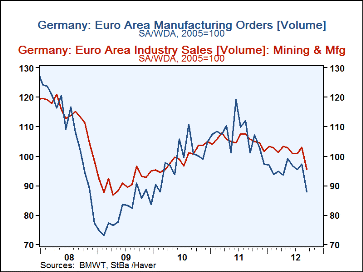
German manufacturing is beginning to be seriously affected by the slow downs in other euro area countries. German Manufacturing and Mining Sales declined 2.9% in September from August and were 2.5% below September of a year ago. New orders declined 3.3% in September and were 4.6% below September 2011. Total sales and new orders are shown in the first chart. The major factors affecting the decline in sales and new orders were sales to, and new orders from, fellow euro area countries. Foreign sales and new orders in the euro area fell 7.4% and 9.6%, respectively, in September from August. and 9.7% and 13.0%, respectively, from September of 2011. The sales and new orders of the foreign euro area are shown in the second chart.
Foreign sales and new orders in the non Euro Areas fared much better. Sales and new orders to these areas fell only 1.5% in September from August and both were higher than a year ago--the only areas to show year to year increases. Foreign sales to non euro areas were 4.8% above September of 2011 and foreign new orders from non euro areas were 3.4% above September, 2011. Domestic sales declined 2.0% in September from August and were 2.4% below a year ago. Domestic new orders were down 2.0% in September and were 6.4% below September 2011.
Another indicator, released today, suggesting that German manufacturing is slowing is the diffusion index of German purchasing managers in manufacturing. This indicator fell to 46.0 in October from 47.4 in September. There has also been a small increase in the registered unemployment rate from 6.8% in August to 6.9% in September and October. Though it is small, it is the first increase in this measure since mid 2009.
| Germany | ||||||||
|---|---|---|---|---|---|---|---|---|
| Sep'12 | Aug'12 | Sep'11 | M/M %Chg | Y/Y % Chg | 2011 | 2010 | 2009 | |
| Manufacturing Sales (2005=100) | 106.5 | 109.7 | 109.2 | -2.92 | -2.47 | 108.7 | 101.2 | 91.8 |
| Domestic | 100.5 | 102.6 | 104.2 | -2.05 | -2.44 | 103.4 | 96.6 | 90.9 |
| Foreign | 114.0 | 118.7 | 115.6 | -3.96 | -1.38 | 115.4 | 107.0 | 92.9 |
| Euro Area | 95.6 | 103.1 | 105.7 | -7.37 | -9.65 | 105.3 | 99.3 | 91.3 |
| Non Euro Area | 130.3 | 132.3 | 124.3 | -1.51 | 4.83 | 124.2 | 113.7 | 94.4 |
| Manufacturing New Orders (2005=100) | 105.4 | 109.0 | 110.5 | -3.30 | -4.62 | 114.0 | 105.8 | 87.3 |
| Domestic | 101.1 | 103.0 | 108.0 | -1.84 | -6.39 | 110.3 | 102.7 | 88.6 |
| Foreign | 109.1 | 114.3 | 112.7 | -4.55 | -3.19 | 117.2 | 108.5 | 86.1 |
| Euro Area | 88.0 | 97.3 | 101.1 | -9.56 | -12.96 | 107.0 | 99.0 | 81.5 |
| Non Euro Area | 126.3 | 128.2 | 122.2 | -1.48 | 3.36 | 125.5 | 116.3 | 89.8 |
More Economy in Brief
 Global| Feb 05 2026
Charts of the Week: Balanced Policy, Resilient Data and AI Narratives
by:Andrew Cates


