 Global| Jan 17 2020
Euro Area Trade Surplus Shrinks
Summary
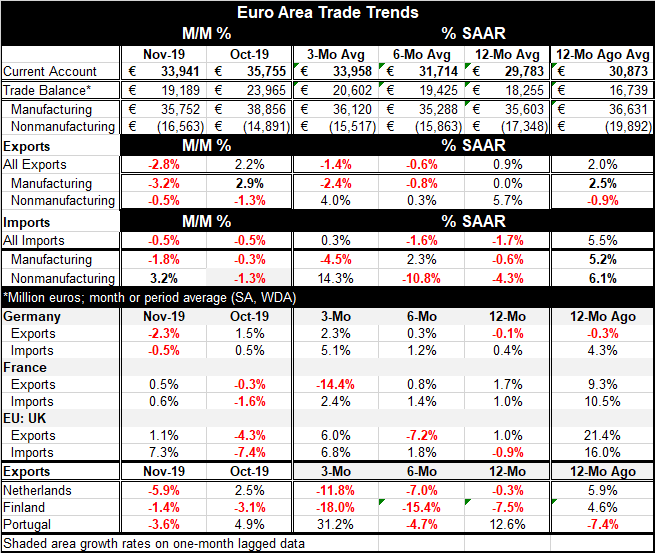
The EMU current account surplus fell to 33.94 billion euros in November from 35.76 billion euros in October. Year-on-year the current account surplus is slightly larger and the November total is also above the 12-month average. The [...]
 The EMU current account surplus fell to 33.94 billion euros in November from 35.76 billion euros in October. Year-on-year the current account surplus is slightly larger and the November total is also above the 12-month average.
The trade balance registers a smaller surplus in November than in October. It is also slightly smaller than its 12-month average but it is larger than the surplus of 12-months ago.
It is useful to look at the trade flows and balances from the perspective of manufacturing vs. nonmanufacturing trade since the two flows represents very different forces at work. Nonmanufactured goods flows are subject to volatile commodity price movements while manufacturing flows are more closely tied to fundamental economic trends.
Yet, if we look at the euro area trade balances from 2001 onward, it is the manufacturing balance that is the more volatile one. This is because of the manufacturing balance being essentially flat at two different levels during the period surrounding the global financial crisis. Before 2008, the manufacturing balance was creeping up from just-below to just-above 20 billion euros. After 2012, the manufacturing surplus hovered around a value of 35 billion euros.
From 2004 through 2008, the German nonmanufacturing deficit deepened from around -10 billion euros to -30 billion euros. That resulted in a near balanced German overall trade position from what has previously been a surplus condition. The overall balance slipped into deficit around 2005 and stayed there through 2008 (and into 2011). But by 2012 when global recovery had been restored (even if unevenly), the German overall trade position moved to a surplus that steadied around the 20 billion euro level as the nonmanufacturing deficit moved up from -30 billion euros to bounce around in a range from -10 billion euros to -20 billion euros.
In November, we find the trade data still more or less clinging to these benchmarks. The overall trade position is at 19.19 billion euros with manufacturing at 35.75 billion euros and the nonmanufacturing balance at -16.56 billion euros. Over the course of the year, there has not been much change as each of these balances is quite near its 12-month average.
Over the year exports have generally weakened and declined while imports that had been declining moved to a more neutral position. The weakening of exports tended to reduce the overall surplus as the strengthening in imports tended to increase it, accounting for little overall change in the manufactured goods surplus on the year.
There were offsetting flows in manufacturing vs. some net change in nonmanufacturing flows. Exports of manufactured goods clearly weakened as imports sporadically weakened over the year. The year-on-year changes saw manufactured exports flat with imports weaker by just 0.6%. For nonmanufactures, exports grew consistently without any clear accelerating or decelerating trends. Imports of nonmanufactures fell on the year but were volatile in the way that developed. Exports of nonmanufactures rose by about 5.7% while imports fell by 4.3%. Those two developments created a 5 billion euro reduction in the overall trade surplus because of a smaller deficit in nonmanufacturing trade from November to November, a period during which the manufacturing balance was quite steady.
Country level developments
Country level trends do not add much to the story. German exports fell on the year but were stronger at yearend. French exports rose on the year but were weakening at year end. Dutch and Finish exports both saw persistent and accelerating declines. Portugal saw volatility with a solid year-on-year export gain. There is little in these flows to add to an overall story of euro area trade beyond that fact that members were experiencing different degrees of success in international trade trends.
Ahead...
Looking ahead, there are hopes for 2020. The U.S. and China did sign their Phase-One trade deal. There is a split opinion about whether there will be an agreement on a substantial Phase-Two or not. China’s GDP growth that weakened to a 6.3% pace, the weakest since 1990, explains clearly why China cut a trade deal at all. Its economy was being hurt deeply by the tariffs and restrictions and China needed to get relief and to stop the ratcheting up of tariffs. However, all this points out how much damage the trade war did and we are still awaiting the U.K. and EU Brexit negotiations as well as other trade negotiations that U.S. has. These include a spat with France over a new tax the U.S. claims targets its tech companies. The year ahead is not without risk. We can’t say we put ‘all that behind us’ in 2019 because we still have not. Much of the heavy lifting still lies ahead.

Robert Brusca
AuthorMore in Author Profile »Robert A. Brusca is Chief Economist of Fact and Opinion Economics, a consulting firm he founded in Manhattan. He has been an economist on Wall Street for over 25 years. He has visited central banking and large institutional clients in over 30 countries in his career as an economist. Mr. Brusca was a Divisional Research Chief at the Federal Reserve Bank of NY (Chief of the International Financial markets Division), a Fed Watcher at Irving Trust and Chief Economist at Nikko Securities International. He is widely quoted and appears in various media. Mr. Brusca holds an MA and Ph.D. in economics from Michigan State University and a BA in Economics from the University of Michigan. His research pursues his strong interests in non aligned policy economics as well as international economics. FAO Economics’ research targets investors to assist them in making better investment decisions in stocks, bonds and in a variety of international assets. The company does not manage money and has no conflicts in giving economic advice.
More Economy in Brief


