 Global| Sep 04 2007
Euro area PPI ex Energy is Excessive but Slowly Behaving
Summary
The EMU ex-energy PPI inflation rate is excessive. It is up by 0.2% in the month and at a 2.4% pace over three-months. Still over six-month its pace had been 3.2%. That deceleration is a hopeful sign, but it still leaves the pace of [...]
The EMU ex-energy PPI inflation rate is excessive. It is up by 0.2% in the month and at a 2.4% pace over three-months. Still over six-month its pace had been 3.2%. That deceleration is a hopeful sign, but it still leaves the pace of the PPI above the Yr/Yr inflation rate of 2.9%. In any event the ECB inflation guideline is for inflation below 2%; having the PPI running at a pace in excess of that is not helpful.
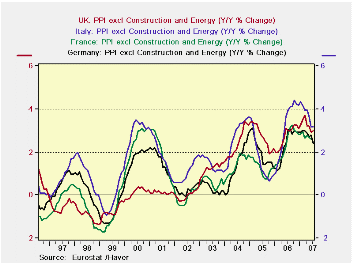
All main sectors three-month inflation rates are above the 2% ceiling except for capital goods. The overall pace of ex-energy inflation is 2.4% for three months and 2.9% Yr/Yr. For Germany and Italy ex energy inflation is lower Yr/yr compared to the year previous period and the 3-month inflation rates each are lower that their respective six month counterpart rates. In the UK Yr/Yr ex-energy inflation is steady at 3% but over three months ex-energy inflation is lower at 2.5%.
The situation for W. Europe seems to be that inflation is on its way to behaving if only at a slow pace. Still that is something and with the weakness and concerns about subprime and the financial sector that just might be enough to help to keep the ECB’s next rate hike at bay.
| M/M | SAAR | |||||
| Euro area 13 | Jul-07 | Jun-07 | 3-Mo | 6-MO | Yr/Yr | Y/Y Yr Ago |
| Total ex Construction | 0.3% | 0.1% | 2.8% | 3.7% | 1.8% | 6.0% |
| Excl Energy | 0.2% | 0.1% | 2.4% | 3.2% | 2.9% | 3.5% |
| Capital Goods | 0.1% | 0.0% | 0.6% | 1.1% | 1.7% | 1.6% |
| Consumer Goods | 0.3% | 0.2% | 2.8% | 2.6% | 1.8% | 1.9% |
| Intermediate & Capital Goods | 0.1% | 0.1% | 2.2% | 3.5% | 3.5% | 4.3% |
| Energy | 0.5% | -0.1% | 4.3% | 5.6% | -1.9% | 14.8% |
| MFG | 0.3% | 0.2% | 4.1% | 5.6% | 2.3% | 4.3% |
| Germany | -0.1% | 0.2% | 1.7% | 2.0% | 1.1% | 6.0% |
| Germany ex Energy | 0.1% | 0.2% | 1.8% | 2.8% | 2.4% | 3.0% |
| France | #N/A | 0.2% | #N/A | #N/A | #N/A | 4.0% |
| France ex Energy | #N/A | 0.1% | #N/A | #N/A | #N/A | 2.9% |
| Italy | 0.4% | 0.1% | 3.7% | 4.6% | 2.1% | 7.0% |
| Italy ex Energy | 0.3% | 0.1% | 2.8% | 3.3% | 3.2% | 4.0% |
| UK | 0.6% | 0.6% | 5.9% | -1.6% | 0.4% | 9.8% |
| UK ex Energy | 0.4% | 0.1% | 2.5% | 3.3% | 3.0% | 3.0% |
| Euro area 13 Harmonized PPI excluding Construction. | ||||||
| The Euro area 13 countries are Austria, Belgium, Finland, France, Germany, Greece, Ireland, Italy, Luxembourg, the Netherlands, Portugal, Spain and Slovenia. | ||||||

Robert Brusca
AuthorMore in Author Profile »Robert A. Brusca is Chief Economist of Fact and Opinion Economics, a consulting firm he founded in Manhattan. He has been an economist on Wall Street for over 25 years. He has visited central banking and large institutional clients in over 30 countries in his career as an economist. Mr. Brusca was a Divisional Research Chief at the Federal Reserve Bank of NY (Chief of the International Financial markets Division), a Fed Watcher at Irving Trust and Chief Economist at Nikko Securities International. He is widely quoted and appears in various media. Mr. Brusca holds an MA and Ph.D. in economics from Michigan State University and a BA in Economics from the University of Michigan. His research pursues his strong interests in non aligned policy economics as well as international economics. FAO Economics’ research targets investors to assist them in making better investment decisions in stocks, bonds and in a variety of international assets. The company does not manage money and has no conflicts in giving economic advice.
More Economy in Brief


