 Global| Sep 04 2007
Euro area PPI ex Energy is Excessive but Slowly Behaving
Summary
The EMU ex-energy PPI inflation rate is excessive. It is up by 0.2% in the month and at a 2.4% pace over three-months. Still over six-month its pace had been 3.2%. That deceleration is a hopeful sign, but it still leaves the pace of [...]
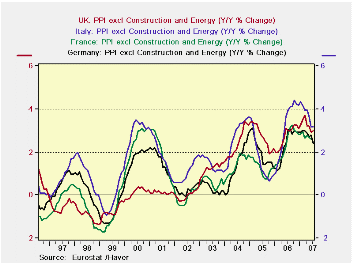
The EMU ex-energy PPI inflation rate is excessive. It is up by 0.2% in the month and at a 2.4% pace over three-months. Still over six-month its pace had been 3.2%. That deceleration is a hopeful sign, but it still leaves the pace of the PPI above the Yr/Yr inflation rate of 2.9%. In any event the ECB inflation guideline is for inflation below 2%; having the PPI running at a pace in excess of that is not helpful.
All main sectors three-month inflation rates are above the 2% ceiling except for capital goods. The overall pace of ex-energy inflation is 2.4% for three months and 2.9% Yr/Yr. For Germany and Italy ex energy inflation is lower Yr/yr compared to the year previous period and the 3-month inflation rates each are lower that their respective six month counterpart rates. In the UK Yr/Yr ex-energy inflation is steady at 3% but over three months ex-energy inflation is lower at 2.5%.
The situation for W. Europe seems to be that inflation is on its way to behaving if only at a slow pace. Still that is something and with the weakness and concerns about subprime and the financial sector that just might be enough to help to keep the ECB’s next rate hike at bay.
| M/M | SAAR | |||||
| Euro area 13 | Jul-07 | Jun-07 | 3-Mo | 6-MO | Yr/Yr | Y/Y Yr Ago |
| Total ex Construction | 0.3% | 0.1% | 2.8% | 3.7% | 1.8% | 6.0% |
| Excl Energy | 0.2% | 0.1% | 2.4% | 3.2% | 2.9% | 3.5% |
| Capital Goods | 0.1% | 0.0% | 0.6% | 1.1% | 1.7% | 1.6% |
| Consumer Goods | 0.3% | 0.2% | 2.8% | 2.6% | 1.8% | 1.9% |
| Intermediate & Capital Goods | 0.1% | 0.1% | 2.2% | 3.5% | 3.5% | 4.3% |
| Energy | 0.5% | -0.1% | 4.3% | 5.6% | -1.9% | 14.8% |
| MFG | 0.3% | 0.2% | 4.1% | 5.6% | 2.3% | 4.3% |
| Germany | -0.1% | 0.2% | 1.7% | 2.0% | 1.1% | 6.0% |
| Germany ex Energy | 0.1% | 0.2% | 1.8% | 2.8% | 2.4% | 3.0% |
| France | #N/A | 0.2% | #N/A | #N/A | #N/A | 4.0% |
| France ex Energy | #N/A | 0.1% | #N/A | #N/A | #N/A | 2.9% |
| Italy | 0.4% | 0.1% | 3.7% | 4.6% | 2.1% | 7.0% |
| Italy ex Energy | 0.3% | 0.1% | 2.8% | 3.3% | 3.2% | 4.0% |
| UK | 0.6% | 0.6% | 5.9% | -1.6% | 0.4% | 9.8% |
| UK ex Energy | 0.4% | 0.1% | 2.5% | 3.3% | 3.0% | 3.0% |
| Euro area 13 Harmonized PPI excluding Construction. | ||||||
| The Euro area 13 countries are Austria, Belgium, Finland, France, Germany, Greece, Ireland, Italy, Luxembourg, the Netherlands, Portugal, Spain and Slovenia. | ||||||
by Tom Moeller September 4, 2007
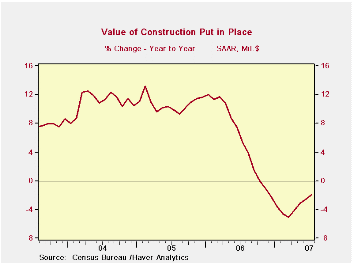
The value of construction put in place fell 0.4% after a 0.1% increase in July. Consensus expectations had been for no change. Year-to-year, the value of total construction has been up 2.0%, but all of the increase has been due to a gain in public construction.
Residential building was down a sharp 1.4%. New single family building fell a whopping 2.2% and brought the y/y decline in activity to 25.3%. Spending on improvements softened the decline with just a 0.1% dip and increased y/y by 2.4%.
During the last twenty years there has been an 84% correlation between the q/q change in the value of residential building and its contribution to growth in real GDP.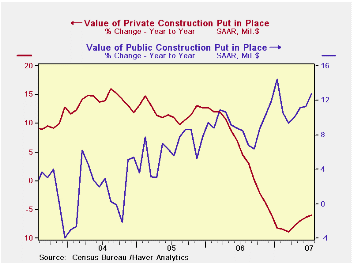
Nonresidential building increased 0.4% for the second consecutive month. The gain lifted y/y gain in activity to 15.4%. Office construction rose 0.6% (10.4% y/y) and construction in the commercial sector popped 1.0% (15.0% y/y) led by a 4.1% rise in multi-retail building (15.7% y/y).
Public construction spending increased 0.7% (12.7% y/y). Though construction on highways & streets fell 4.3% in July, the year-to-year gain amounts to 59.2%. The value of construction on highways and streets is nearly one third of the value of total public construction spending.
These more detailed categories represent the Census Bureau’s reclassification of construction activity into end-use groups. Finer detail is available for many of the categories; for instance, commercial construction is shown for Automotive sales and parking facilities, drugstores, building supply stores, and both commercial warehouses and mini-storage facilities. Note that start dates vary for some seasonally adjusted line items in 2000 and 2002 and that constant-dollar data are no longer computed.
| July | June | Y/Y | 2006 | 2005 | 2004 | |
|---|---|---|---|---|---|---|
| Total | -0.4% | 0.1% | 2.0% | 5.6% | 10.7% | 11.0% |
| Private | -0.7% | -0.2% | -6.0% | 4.7% | 12.0% | 13.8% |
| Residential | -1.4% | -0.6% | -16.1% | 0.5% | 13.7% | 18.7% |
| Nonresidential | 0.4% | 0.4% | 15.4% | 15.2% | 7.8% | 3.8% |
| Public | 0.7% | 1.0% | 12.7% | 9.2% | 6.2% | 1.7% |
by Louise Curley September 4, 2007
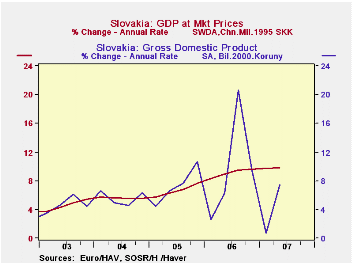
The economy of Slovakia grew 9.4% at an annual rate in the second quarter of this year according to Eurostat data (J936GDPT@EUROSTAT), and 7.52% according to the country sourced data (F936NGPC@EMERGECW). The first chart shows the annual rates of change in the two series. The Eurostat data are based on 1995 Koruna, while the country sourced data are based on 2000 Koruna; however, that is a matter of scale and should not affect percentage changes. A more substantive difference between the two series arises from the fact that the Eurostat series is working day adjusted and has been harmonized. A comparison of the quarterly annual rates of change in the two series, suggests that the working day adjustment and perhaps other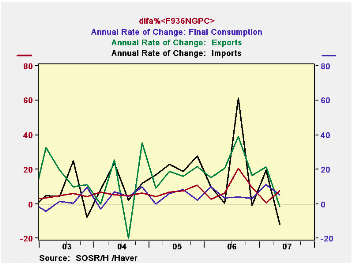 seasonal factors could account for the quarterly differences in the two series since the quarterly differences appear to average out as the annual changes are virtually the same in both series as shown in the table below
Eurostat has, so far, released data only for total GDP for the second quarter, while the country data show the composition of GDP in the second quarter. Consumption increased 5.1% at an annual rate in the second quarter and while exports declined by almost 2%, imports were down almost 12%. The biggest spur to growth was an annual rate of increase of 33.5% in gross capital formation as can be seen in the second chart and in the table below.
| SLOVAKIA | Q2 07 | Q1 07 | Q2 06 | Q/Q DIF | Y/Y DIF | 2006 | 2005 | 2004 |
|---|---|---|---|---|---|---|---|---|
| Real GDP Growth (Annual Rate) | ||||||||
| Eurostat Data | 9.84 | 9.76 | 8.98 | 0.86 | 0.78 | 8.27 | 6.04 | 5.42 |
| Country Sourced Data | 7.52 | 0.72 | 6.29 | 6.80 | 1.23 | 8.28 | 6.03 | 5.41 |
| Personal Consumption Expenditure | 5.08 | 11.37 | 3.34 | -6.29 | 1.74 | 5.61 | 5.01 | 3.58 |
| Gross Capital Formation | 33.55 | -43.55 | 4.45 | 77.10 | 29.45 | 8.20 | 18.66 | 14.20 |
| Export | -1.87 | 21.30 | 20.36 | -23.17 | -22.23 | 20.71 | 13.78 | 7.87 |
| Imports | -11.92 | 19.56 | 0.13 | -31.47 | -12.05 | 17.78 | 16.62 | 8.83 |
by Tom Moeller September 4, 2007
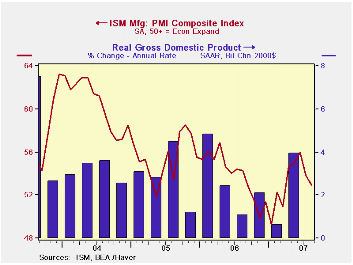
The Institute of Supply Management (ISM) reported that the Composite Index of activity in the manufacturing sector fell slightly last month to 52.9 from 53.8 during July. Consensus expectations had been for a reading of 53.0.
During the last twenty years there has been a 64% correlation between the level of the Composite Index and the three month growth in factory sector industrial production. It is appropriate to correlate the ISM index level with factory sector growth. The ISM index is a diffusion index. It measures growth by being constructed using all of the absolute change in activity added to one half of the no change in activity measures.
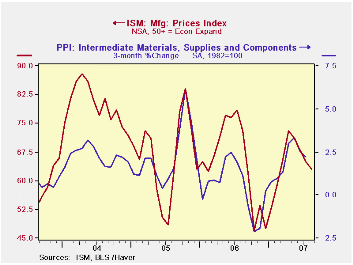
The prices index also fell two points to its lowest level since February. During the last twenty years there has been a 77% correlation between the price index and the three month change in the PPI for intermediate goods.
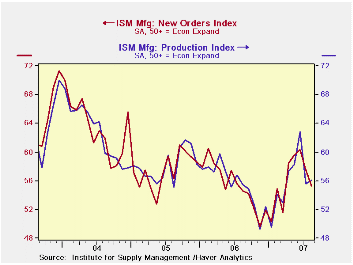
Declines in three of the index's five components led the composite index 's decline last month. New orders fell 2.2 points to its lowest since March. The inventory index and the supplier delivery measure fell as well. The employment index, however, rose to the highest level in four months and production index recouped a small piece of its sharp July decline. During the last twenty years there has been a 67% correlation between the level of the ISM employment Index and the three month growth in factory sector employment.
The index of new export orders rose slightly to its highest level in three months. The import index, however, fell sharply to its lowest level since 2003.
The prices paid index fell two points to its lowest level since February. During the last twenty years there has been a 77% correlation between the price index and the three month change in the PPI for intermediate goods.
| Composite Index | 52.9 | 53.8 | 54.3 | 53.9 | 55.5 | 60.5 | ||||||||||||||
| New Orders Index | 55.3 | 57.5 | 54.6 | 55.4 | 57.4 | 63.5 | ||||||||||||||
| Prices Paid Index (NSA) | 63.0 | 73.0 | 78.5 | 65.0 | 66.4 | 79.8 |

Robert Brusca
AuthorMore in Author Profile »Robert A. Brusca is Chief Economist of Fact and Opinion Economics, a consulting firm he founded in Manhattan. He has been an economist on Wall Street for over 25 years. He has visited central banking and large institutional clients in over 30 countries in his career as an economist. Mr. Brusca was a Divisional Research Chief at the Federal Reserve Bank of NY (Chief of the International Financial markets Division), a Fed Watcher at Irving Trust and Chief Economist at Nikko Securities International. He is widely quoted and appears in various media. Mr. Brusca holds an MA and Ph.D. in economics from Michigan State University and a BA in Economics from the University of Michigan. His research pursues his strong interests in non aligned policy economics as well as international economics. FAO Economics’ research targets investors to assist them in making better investment decisions in stocks, bonds and in a variety of international assets. The company does not manage money and has no conflicts in giving economic advice.
More Economy in Brief


