 Global| Jun 14 2010
Euro-Area IP On An Upswing, Except For Consumer Goods
Summary
Industrial output in the euro-area is still putting out some good gains. This is despite the fact that the consumer goods sector continues to lag and to decline. Overall EMU output rose by 0.6% m/m in April after a gain of 1.8% in [...]
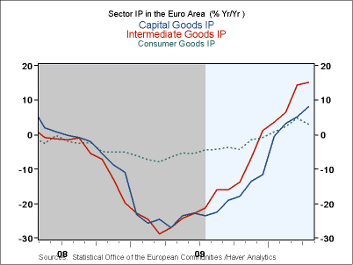 Industrial output in the euro-area is still putting out some good
gains. This is despite the fact that the consumer goods sector
continues to lag and to decline. Overall EMU output rose by 0.6% m/m in
April after a gain of 1.8% in March and of 0.8% in February. The
strength is real. In April consumer goods output fell by 0.9% over
three-months, however, consumer goods output is up at just a 1%
annualized rate compared to a 13.5% pace for all of output.
Capital goods output is growing at a accelerating pace from 12-months to six months to three months. Intermediate goods are not quite on such a clear acceleration but growth rates have been high and steady with strong growth over three-months. Consumer goods output has accelerated from 12-months to six months and has since been subdued.
In the quarter to date -just one month into the new quarter- output is growth sharply over the Q1 base. Output is up at a 13% pace in Q2 lead by a rise at a 22% pace by intermediate goods and a 15% pace by capital goods. The quarterly growth rate is held back by consumer goods where output is shrinking at nearly a 1% annual rate.
This is a familiar set of facts. We have been talking about these trends in Europe for some time. The expansion seems solid enough despite all the concerns. Mount enough concerns and they can sink the healthiest of economies. But Europe is not there yet. It still seems to be doing fine. The capital goods and intermediate goods sectors are driving output ahead, but the lagging consumer goods sector remains an impediment to getting into that next gear.
Europe needs to more home grown demand. Europe needs to get its consumer in gear. But growth is still quite solid and is not showing any sign of decelerating and certainly none of declining. With such a sharp drop in the euro in the background I think investor worries about Europe are entirely in the wrong direction.
| Euro-Area MFG IP | ||||||||||
|---|---|---|---|---|---|---|---|---|---|---|
| Saar except m/m | Mo/Mo | Apr 10 |
Mar 10 |
Apr 10 |
Mar 10 |
Apr 10 |
Mar 10 |
|||
| Euro-Area Detail | Apr 10 |
Mar 10 |
Feb 10 |
3Mo | 3Mo | 6mo | 6mo | 12mo | 12mo | Q1 |
| MFG | 0.6% | 1.8% | 0.8% | 13.5% | 19.6% | 15.0% | 13.8% | 9.1% | 7.9% | 13.1% |
| Consumer | -0.9% | 1.2% | 0.0% | 1.0% | 9.0% | 6.4% | 6.1% | 2.9% | 4.8% | -0.9% |
| C-Durables | -0.1% | 0.1% | 0.4% | 1.9% | 11.4% | 6.5% | 7.0% | 1.2% | 1.3% | |
| C-Non-durables | -1.2% | 1.6% | 0.1% | 1.9% | 10.9% | 6.3% | 6.1% | 3.0% | 5.5% | |
| Intermediate | 2.2% | 1.1% | 1.2% | 19.7% | 12.2% | 11.9% | 9.1% | 15.1% | 14.3% | 22.1% |
| Capital | 1.0% | 1.7% | 0.7% | 14.7% | 6.8% | 9.3% | 5.9% | 8.1% | 5.2% | 15.5% |
| Main Euro-Area Countries and UK IP in MFG | ||||||||||
| Mo/Mo | Apr 10 |
Mar 10 |
Apr 10 |
Mar 10 |
Apr 10 |
Mar 10 |
||||
| MFG Only | Apr 10 |
Mar 10 |
Feb 10 |
3Mo | 3Mo | 6mo | 6mo | 12mo | 12mo | Q:4 Date |
| Germany: | 0.6% | 3.9% | 0.0% | 19.2% | 19.3% | 9.9% | 4.6% | 14.1% | 10.2% | 20.5% |
| France: IPxConstruct'n |
-0.3% | 1.3% | 0.1% | 4.5% | 10.7% | 6.4% | 6.9% | 7.9% | 7.1% | 3.6% |
| Italy | 1.2% | 0.1% | 0.5% | 7.2% | 9.3% | 7.0% | 6.3% | 8.1% | 7.4% | 8.7% |
| Spain | -1.5% | 5.4% | 1.6% | 24.0% | 14.8% | 2.4% | 4.6% | 2.8% | 5.0% | 16.1% |
| UK: EU member | -0.3% | 2.2% | 1.6% | 14.7% | 10.2% | 7.4% | 8.1% | 3.5% | 3.7% | 10.4% |
by Louise Curley June 14, 2010
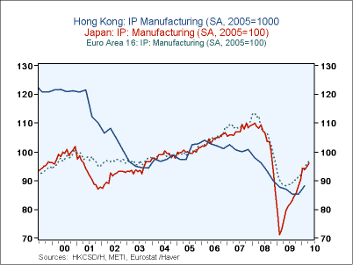 Industrial
production in most countries has shown improvement in the first few
months of this year. Today data for the first quarter for
Hong Kong and for April of this year for Japan and the entire Euro Area
were released. The data are shown in the attached
chart. For comparability, the original index for Hong Kong
based on 2008=100 was changed to 2005=100, the base of the other two
series, using the "advanced function" in DLX. In addition since the
data for Hong Kong are for the manufacturing sector only, we have used
data for the manufacturing data for Japan and the Euro Area instead of
their total industrial production figures that includes mining,
quarrying, electricity, gas and water supply and construction.
Of the two countries and the Euro Area, manufacturing production in Japan was the first to decline and has experienced the sharpest decline and recovery. In April, manufacturing production in Japan was 95.9 (2005-100) 34.7% above the low point of 71.2 in February, 2009. The comparable figures for the Euro Area are 9.7% and 88.2 in May 2009. The data for Hong Kong are quarterly, and therefore, somewhat less volatile than the monthly figures. By the first quarter of this year, manufacturing production in Hong Kong was 88.1 (2005=100) or 3.3% above the low of 85.3 reached in the 3rd quarter of 2009.
| IP: Manufacturing (SA, 2005=100) | Apr 10 |
Mar 10 |
Feb 10 |
Jan 10 |
Dec 09 |
Nov 09 |
Oct 09 |
Sep 09 |
Aug 09 |
|---|---|---|---|---|---|---|---|---|---|
| Japan | 95.9 | 94.7 | 93.6 | 94.2 | 90.3 | 88.0 | 85.8 | 84.4 | 82.9 |
| Euro Area | 96.6 | 96.1 | 94.3 | 93.6 | 91.8 | 91.5 | 90.1 | 90.1 | 89.1 |
| Q1 10 | Q4 09 | Q3 09 | |||||||
| Hong Kong | -- | -- | 88.1 | -- | -- | 85.4 | -- | -- | 85.3 |
by Tom Moeller June 14, 2010
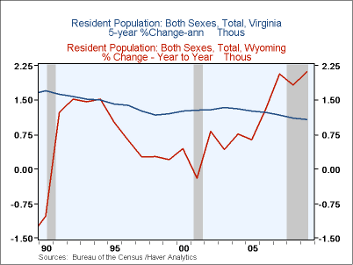
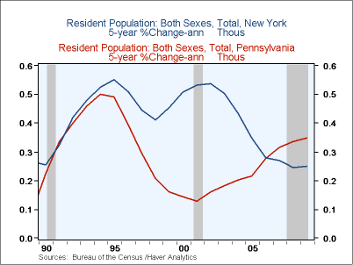
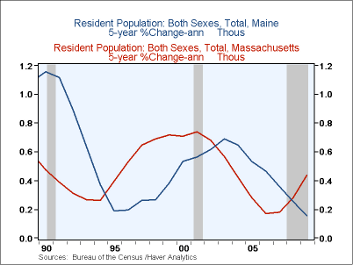
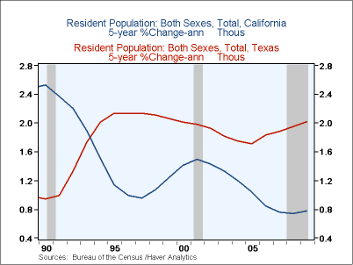
Population growth in the United States has been declining steadily since the early-1990s. Specifically, growth of 1.0% during the last nine years is off from the early-1990s' high of 1.4% and is well below the 1.5%-2.5% growth rates from the mid-1940s to the mid-1960s. Analyzing all of the reasons for the slowdown is beyond the scope of this presentation, yet one thing is clear. The Southern and Western states have seen accelerated growth at the expense of most other sections of the country.
Suffering the greatest decline has been population growth in the country's extreme Northeast. Maine actually experienced net out-migration last year. Chronically slow population growth also characterizes the Northeast and the Midwestern regions with relatively high housing costs and the falloff in factory sector output as a percent of the economy. Michigan also experienced net outmigration during the last four years.
Net-population advances characterizes states in most other regions of the country. During the last five years the strongest growth rates have been in Wyoming, Texas, North Carolina and Colorado. Relatively low housing costs, an aging population as well as an increased ability to communicate electronically has aided population growth in these states. California, however, has seen population growth decelerate sharply with high unemployment and high home-foreclosures.
The data used in the above analysis is available in Haver's USPOP database.
| Population Growth (%) | 2009 | 2008 | 2007 | 2006 |
|---|---|---|---|---|
| United States | 0.9 | 0.9 | 1.0 | 1.0 |
| Maine | -0.1 | 0.2 | 0.2 | 0.3 |
| New Hampshire | 0.2 | 0.3 | 0.4 | 0.8 |
| Vermont | 0.1 | 0.1 | 0.1 | 0.2 |
| New York | 0.4 | 0.2 | 0.3 | 0.1 |
| New Jersey | 0.5 | 0.3 | 0.1 | 0.0 |
| Massachusetts | 0.8 | 0.7 | 0.5 | 0.2 |
| Pennsylvania | 0.3 | 0.4 | 0.4 | 0.4 |
| Louisiana | 1.0 | 1.7 | 3.2 | -5.7 |
| Virginia | 1.1 | 1.0 | 1.0 | 1.1 |
| North Carolina | 1.5 | 2.0 | 2.2 | 2.3 |
| Georgia | 1.4 | 1.7 | 2.2 | 2.6 |
| Florida | 0.7 | 0.8 | 1.1 | 1.1 |
| Michigan | -0.3 | -0.5 | -0.3 | -0.1 |
| Illinois | 0.5 | 0.5 | 0.5 | 0.3 |
| Indiana | 0.5 | 0.7 | 0.7 | 0.8 |
| Minnesota | 0.7 | 0.8 | 0.8 | 0.8 |
| Ohio | 0.1 | 0.1 | 0.3 | 0.2 |
| Kansas | 0.8 | 0.8 | 0.7 | 0.5 |
| Texas | 2.0 | 2.0 | 2.0 | 2.5 |
| Arizona | 1.5 | 2.2 | 2.8 | 3.6 |
| Colorado | 1.8 | 1.9 | 1.9 | 2.0 |
| Wyoming | 2.1 | 1.8 | 2.1 | 1.3 |
| California | 1.0 | 1.0 | 0.7 | 0.5 |
| Washington | 1.5 | 1.6 | 1.5 | 1.8 |
| Nevada | 1.0 | 1.9 | 3.0 | 3.5 |
Robert Brusca
AuthorMore in Author Profile »Robert A. Brusca is Chief Economist of Fact and Opinion Economics, a consulting firm he founded in Manhattan. He has been an economist on Wall Street for over 25 years. He has visited central banking and large institutional clients in over 30 countries in his career as an economist. Mr. Brusca was a Divisional Research Chief at the Federal Reserve Bank of NY (Chief of the International Financial markets Division), a Fed Watcher at Irving Trust and Chief Economist at Nikko Securities International. He is widely quoted and appears in various media. Mr. Brusca holds an MA and Ph.D. in economics from Michigan State University and a BA in Economics from the University of Michigan. His research pursues his strong interests in non aligned policy economics as well as international economics. FAO Economics’ research targets investors to assist them in making better investment decisions in stocks, bonds and in a variety of international assets. The company does not manage money and has no conflicts in giving economic advice.


