 Global| Apr 16 2007
Euro Area Inflation Shows a Prickly Side in March
Summary
The EU-13 headline HICP rose sharply and so did the core measure in March. Goods prices had all of the momentum, as services prices were dead flat in the month. As for broad trends, the HICP and the HICP Core for the EU-13 shows [...]
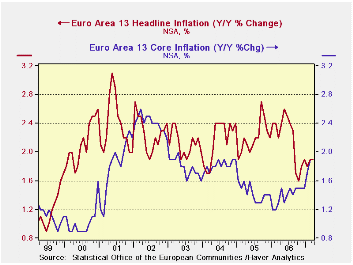
The EU-13 headline HICP rose sharply and so did the core measure in March. Goods prices had all of the momentum, as services prices were dead flat in the month.
As for broad trends, the HICP and the HICP Core for the EU-13 shows pressure in both measures. The year-over-year growth rate for the core had dropped to a low of 1.2% in early 2006. But since then the Core has been in the grip of a steady upward trend for the year-over-year rate. It now stands at 1.9%, a bit higher that it was in 2003 and 2004 before the drop in the core set in. And there is still the question about upward momentum.
However the sequential growth rates are in better shape, in the sense that their signal is not as clearly bad as the year-over-year pattern for the core (see the table). They show an acceleration in goods prices from 1-year to 6-months to 3-months, but Service sector inflation does not have a real definable trend. It is growing at a 1.8% pace over three months, however. Despite the break in services inflation for the month of March the trend has not broken lower in terms of sequential growth rates.
Sequential trends for Core rates across Main EMU countries show mixed patterns. For all the main EMU countries 3-month inflation pressure has been alleviated in the recent period compared to earlier in the year. In the case of Spain inflation has been steadily decelerating from the year/year pace of one year ago (2.8%) to -1.8% over the recent three months. Italy also shows deceleration within the current year.
| % Mo/Mo | % SAAR | ||||||
| Mar-07 | Feb-07 | Jan-07 | 3-Mo | 6-Mo | 12-Mo | Yr Ago | |
| EU-13 | 0.7% | 0.3% | -0.5% | 1.8% | 1.9% | 1.9% | 2.2% |
| Core | 0.7% | 0.4% | -0.9% | 0.7% | 2.1% | 1.9% | 1.3% |
| Goods | 1.1% | 0.1% | -0.8% | 1.8% | 1.6% | 1.7% | 2.4% |
| Services | 0.0% | 0.5% | -0.1% | 1.8% | 2.4% | 2.4% | 1.9% |
| HICP | |||||||
| Germany | 0.2% | 0.5% | -0.2% | 2.0% | 2.8% | 2.0% | 1.9% |
| France | 0.5% | 0.2% | -0.4% | 1.2% | 0.8% | 1.2% | 1.7% |
| Italy | 1.2% | 0.1% | -1.1% | 0.8% | 1.2% | 2.1% | 2.2% |
| UK | #N/A | 0.5% | -0.8% | #N/A | #N/A | #N/A | 1.8% |
| Spain | 0.8% | 0.1% | -0.7% | 0.5% | 2.1% | 2.5% | 3.9% |
| Core excl Food Energy and Alcohol | |||||||
| Germany | 0.0% | 0.5% | -0.6% | -0.4% | 2.2% | 1.6% | 0.5% |
| France | 0.5% | 0.4% | -0.5% | 1.3% | 1.7% | 1.5% | 1.3% |
| Italy | 1.5% | 0.1% | -1.6% | 0.0% | 1.4% | 2.0% | 1.6% |
| UK | #N/A | 0.4% | -1.0% | #N/A | #N/A | #N/A | 1.2% |
| Spain | 0.7% | 0.1% | -1.3% | -1.8% | 2.6% | 2.6% | 2.8% |

Robert Brusca
AuthorMore in Author Profile »Robert A. Brusca is Chief Economist of Fact and Opinion Economics, a consulting firm he founded in Manhattan. He has been an economist on Wall Street for over 25 years. He has visited central banking and large institutional clients in over 30 countries in his career as an economist. Mr. Brusca was a Divisional Research Chief at the Federal Reserve Bank of NY (Chief of the International Financial markets Division), a Fed Watcher at Irving Trust and Chief Economist at Nikko Securities International. He is widely quoted and appears in various media. Mr. Brusca holds an MA and Ph.D. in economics from Michigan State University and a BA in Economics from the University of Michigan. His research pursues his strong interests in non aligned policy economics as well as international economics. FAO Economics’ research targets investors to assist them in making better investment decisions in stocks, bonds and in a variety of international assets. The company does not manage money and has no conflicts in giving economic advice.
More Economy in Brief


