 Global| Aug 21 2007
Euro Area Export and Import Growth Both Tic Up in June
Summary
Exports were up more strongly in June than were imports shrinking the Euro area trade deficit in the month. Exports have a reasonably strong history of growth across its main categories. Import growth also has been firm and broad- [...]
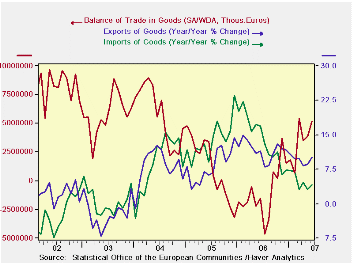
Exports were up more strongly in June than were imports shrinking the Euro area trade deficit in the month. Exports have a reasonably strong history of growth across its main categories. Import growth also has been firm and broad-based. However, manufacturing exports and imports are the slowest year-over-year. Manufacturing exports are rising at an 8.8% pace compared to imports at 7.6%. But over short time horizons both export and import growth has slowed.
| M/M% | % SAAR | ||||
| Jun-07 | May-07 | 3M | 6M | 12M | |
| Balance* | €€ 5,217 | €€ 3,893 | €€ 4,211 | €€ 3,427 | €€ 1,563 |
| Exports | |||||
| All Exports | 1.7% | 0.6% | 8.8% | 4.9% | 10.1% |
| Food and Drinks | -- | 0.5% | 14.7% | 2.3% | 6.0% |
| Raw Materials | -- | 2.3% | 30.0% | 7.4% | 13.6% |
| MFG | -- | 0.8% | 4.6% | -0.1% | 8.8% |
| IMPORTS | |||||
| All Imports | 0.7% | 0.3% | 10.2% | -1.2% | 4.1% |
| Food and Drinks | -- | -0.1% | 15.8% | 7.4% | 6.0% |
| Raw Materials | -- | 2.3% | 14.7% | 5.4% | 16.3% |
| MFG | -- | 1.6% | 4.1% | 4.3% | 7.6% |
| *Eur mlns; mo or period average; Gray shaded areas lag one month | |||||
by Louise Curley August 21, 2007
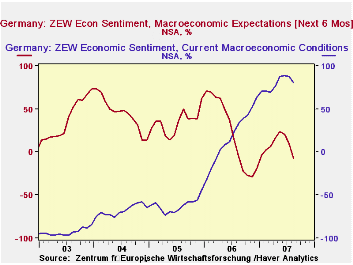
The ZEW indicator of confidence among German institutional investors and analysts showed that pessimists outweighed optimists by 6.9% in August. In July, optimists outweighed pessimists by 10.9% in July. The decline of 17.3 percentage points was the largest since the decline of 20.7 last August. The participants' appraisal of current conditions fell by 8 percentage points from 88.2 in July to 80.2 in August. Expectations and appraisals of current conditions are shown in the first chart.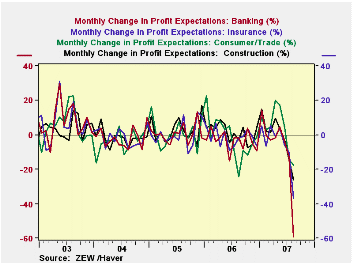
The turmoil in stock markets around the world during the period when the survey took place--July 30 to August 20--no doubt affected the participants' expectations and also their outlook for profits in selected industries.
Profit expectations for the banking and insurance industries were lowered sharply. For the banking industry, pessimists exceeded optimists by 37.3% in August while in July, optimists had exceeded pessimists by 21.9%. Comparable figures for the insurance industry were 13.2% and 23.7%. Monthly changes in profit expectations for the banking and insurance industries along with those for construction and consumer/trade industries--two other industries where profit expectations showed substantial declines in August are show in the second chart.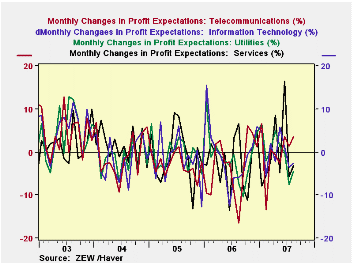
There were some improvements in the monthly changes of profit expectations. Most improvements involved a decline in the excess of pessimists, but profit expectations in the telecommunication industry actually showed an excess of optimists of 3.5%. Monthly changes in profit expectations for the telecommunication industry are shown in the third chart along with those for the information technology, utilities and service industries that also showed improvement in that the excess of pessimists over optimists was lower in August than in July.
| ZEW MEASURES OF CONFIDENCE (%) | Aug 07 | Jul 07 | Aug 06 | M/M Dif | Y/Y Dif | 2006 | 2005 | 2004 |
|---|---|---|---|---|---|---|---|---|
| Expectations | -6.9 | 10.4 | -5.6 | -17.3 | -1.3 | 22.3 | 34.8 | 44.6 |
| Current conditions | 80.2 | 88.2 | 33.6 | -8.0 | 46.6 | 18.3 | -61.8 | -67.7 |
by Tom Moeller August 21, 2007
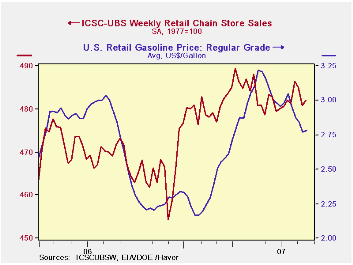
The average level of store sales, thus, so far in August is just even with the July level which rose 0.4% from June.
During the last ten years there has been a 45% correlation between the y/y change in chain store sales and the change in non-auto retail sales less gasoline.
The ICSC-UBS retail chain-store sales index is constructed using the same-store sales (stores open for one year) reported by 78 stores of seven retailers: Dayton Hudson, Federated, Kmart, May, J.C. Penney, Sears and Wal-Mart.
The leading indicator of chain store sales from ICSC-UBS was unchanged from the prior week (1.9% y/y).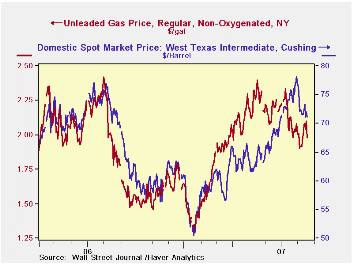
Gasoline prices for regular, on average rose one penny last week to $2.78 per gallon (-4.8% y/y).
The average gas price so far in August is 5.6% lower than in July and prices have fallen 13.5% from their peak during May of $3.22 per gallon.
The market price for regular gasoline in N.Y. harbor increased yesterday to $1.98 (11.1% y/y) and so far in August has averaged roughly 6.8% lower than during July.
For crude oil, the price for West Texas Intermediate fell yesterday to $71.13 per barrel and so far in August has averaged $73.60, 0.2% below July.
| ICSC-UBS (SA, 1977=100) | 08/18/07 | 08/11/06 | Y/Y | 2006 | 2005 | 2004 |
|---|---|---|---|---|---|---|
| Total Weekly Chain Store Sales | 482.0 | 480.8 | 2.7% | 3.3% | 3.6% | 4.7% |

Robert Brusca
AuthorMore in Author Profile »Robert A. Brusca is Chief Economist of Fact and Opinion Economics, a consulting firm he founded in Manhattan. He has been an economist on Wall Street for over 25 years. He has visited central banking and large institutional clients in over 30 countries in his career as an economist. Mr. Brusca was a Divisional Research Chief at the Federal Reserve Bank of NY (Chief of the International Financial markets Division), a Fed Watcher at Irving Trust and Chief Economist at Nikko Securities International. He is widely quoted and appears in various media. Mr. Brusca holds an MA and Ph.D. in economics from Michigan State University and a BA in Economics from the University of Michigan. His research pursues his strong interests in non aligned policy economics as well as international economics. FAO Economics’ research targets investors to assist them in making better investment decisions in stocks, bonds and in a variety of international assets. The company does not manage money and has no conflicts in giving economic advice.
More Economy in Brief


