 Global| May 28 2019
EU Commission Readings Show Signs of Life!
Summary
The EU Commission index rose to 105.1 in May, a rise that brings it up still short of its March reading; this is its first increase after 15 straight months of declines. There were improvements in the readings for each of the largest [...]
 The EU Commission index rose to 105.1 in May, a rise that brings it up still short of its March reading; this is its first increase after 15 straight months of declines. There were improvements in the readings for each of the largest four EMU economies this month to bolster the headline gain with France making the largest rise on the month.
Still, this is a modest reading with a 67th percentile queue standing. That metric indicates that the month’s observation is placed barely in the top one third of its historic queue of monthly results.
Of the 18 reporting EMU nations, all but five of them showed sentiment improvements in May. It is a stunning turnaround from April when only four of eighteen reporters registered increases.
Over 12 months, all indexes are lower on balance. Over six months, only France is higher. Over three months, France, Italy, Spain, Cyprus, Slovenia, and Lithuania are higher.
Weakness across the EMU is still widespread. The monthly increase may be the start of a reversal or just a slowing or a minor interruption of the decay process. So far, there is little in the way of positive data suggesting that there is some improvement in train.
The overall EMU gauge has a 67.4 percentile standing. Ten of eighteen EMU members have weaker standing readings than this while eight have equal or stronger rankings.
The strongest ranking among EMU members is for Lithuania with an 87th percentile queue standing. That is followed by Cyprus at 79.6% and Slovenia at 76.3%. The weakest queue rankings are from Slovakia, Malta, and Belgium.
Sector behaviorLooking at the sectors, we find construction with the strongest queue standing at the 95.3 percentile level, followed by retail (81.8%) and consumer confidence (80.7%). The industrial and services gauges are both much farther down the food chain with nearly identical queue standings. The industrial sector, with a -3 raw diffusion score, has a 59.4 percentile queue standing. The services sector, with a 12 raw diffusion score, has a 59.3 queue percentile standing.

The EU Commission indexes are diffusion surveys and present data in an up minus down format instead of the ISM and Markit practice of offering a statistic that is all of the up responses and half of the down responses scaled by total responses. For the ISM and Markit gauges, the neutral reading is at 50 and data range from zero to 100. On the up/down presentation of data, zero is neutral and the responses range from -100 to +100.
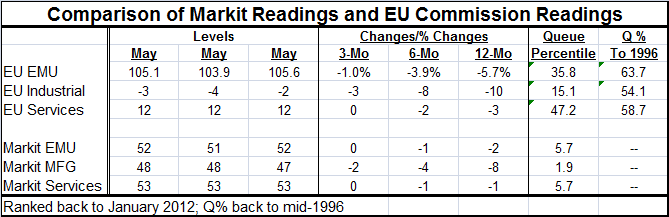
The table below offers side by side comparisons of the EU Commission readings with the Markit diffusion readings. They are simply two different ways to present the same sort of survey data. And of course, the two surveys are different.
Markit vs. EU Commission Indexes
The comparisons show some similarities in the two presentations. The queue percentile readings for the Markit universe of data is weaker for each concept with the EMU reading lower, the manufacturing reading lower and the services reading lower. But the overall EMU gauge has a reading similar to that of services in each conceptual framework and for each it is manufacturing or the industrial sector that is the weakest by some margin.
Also over the last 12 months, the greatest weakness is from manufacturing or industry not for services. The R-square mapping between manufacturing and industry has a 0.69 value whereas for services the R-square shows less correlation with a 0.33 reading. The manufacturing/industrial sectors clearly have a lot in common while the services readings show some of the same forces in train as well as some different ones present. On balance, both sets of surveys point to weakness. The Markit data (flash estimates) still point to further weakness in May while the EU data showed signs of a rebound.
The R-square between the two headlines was tested as the Markit 12-month change vs. the EU Commission gauge’s 12-month percentage change. That pairing turned up a more powerful 0.78 R-square.
It can be confusing to have multiple gauges of the same concepts but it can also be reassuring. While these two reports had some separate and somewhat contrary information in them, on the whole they seem to be telling us the same story about conditions in the EMU. But that does not help us to figure out which of these two signals to believe this month when they each point in different directions.

Robert Brusca
AuthorMore in Author Profile »Robert A. Brusca is Chief Economist of Fact and Opinion Economics, a consulting firm he founded in Manhattan. He has been an economist on Wall Street for over 25 years. He has visited central banking and large institutional clients in over 30 countries in his career as an economist. Mr. Brusca was a Divisional Research Chief at the Federal Reserve Bank of NY (Chief of the International Financial markets Division), a Fed Watcher at Irving Trust and Chief Economist at Nikko Securities International. He is widely quoted and appears in various media. Mr. Brusca holds an MA and Ph.D. in economics from Michigan State University and a BA in Economics from the University of Michigan. His research pursues his strong interests in non aligned policy economics as well as international economics. FAO Economics’ research targets investors to assist them in making better investment decisions in stocks, bonds and in a variety of international assets. The company does not manage money and has no conflicts in giving economic advice.
More Economy in Brief


