 Global| Mar 16 2012
EMU Trade Surplus Shrinks But It Is Still Large
Summary
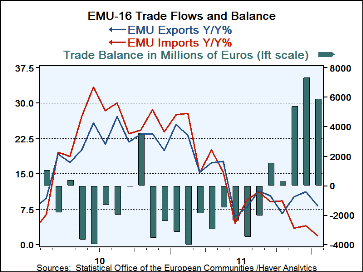
The EMU trade surplus has fallen off month to month but the recent surplus still is large. In EMU domestic demand is collapsing and with it import volume is contacting. Weaker imports have helped even weakening export trends to create [...]
 The EMU trade surplus has fallen off month to month but the recent surplus still is large.
In EMU domestic demand is collapsing and with it import volume is contacting. Weaker imports
have helped even weakening export trends to create a bulge in the region’s trade surplus.
The chart shows clearly that while export and import have trended to track one another, over the past three months imports have spurted and showed much greater weakness.
This month imports blipped up exceed export growth and helped to shrink the trade surplus slightly.
Export growth is still head and shoulders above import growth on all horizons. The EMU trade surplus is positioned to be in place for some time.
Currently there is enough weakness in EMU to constrict imports but EMU has enough of an export base to outside area that exports have kept up and these external markets have continued to be strong. The EMU is keeping its economies going in the ace of austerity and a now-tightening monetary policy by siphoning off the domestic demand from other countries, one of them being the US. We are back to playing that game and before long the US will be widely criticized for running a large trade deficit again. What else is new?
| Euro-Area Trade Trends for Goods | ||||||
|---|---|---|---|---|---|---|
| M/M% | % SAAR | |||||
| Jan-12 | Dec-11 | Nov-11 | 3M | 6M | 12M | |
| Balance* | € 5,902 | € 7,370 | € 5,415 | € 6,229 | € 3,100 | € 212 |
| Exports | ||||||
| All Exp | 1.3% | 0.9% | 3.2% | 24.2% | 14.9% | 8.2% |
| Food and Drinks | - | -0.3% | 1.8% | 35.0% | 22.1% | 7.0% |
| Raw materials | - | 0.6% | 1.8% | 9.1% | 21.5% | 14.4% |
| MFG | - | 2.1% | 4.4% | 30.5% | 20.2% | 13.8% |
| IMPORTS | ||||||
| All IMP | 2.4% | -0.4% | -0.3% | 7.0% | 1.2% | 1.8% |
| Food and Drinks | - | 2.2% | 0.3% | 7.7% | 4.3% | 8.4% |
| Raw Materials | - | -2.0% | 0.6% | -11.2% | -12.3% | 3.3% |
| MFG | - | 0.9% | -0.9% | -5.8% | -1.8% | 0.1% |
| *Eur mlns; mo or period average; Gray shaded areas lag one month | ||||||
Robert Brusca
AuthorMore in Author Profile »Robert A. Brusca is Chief Economist of Fact and Opinion Economics, a consulting firm he founded in Manhattan. He has been an economist on Wall Street for over 25 years. He has visited central banking and large institutional clients in over 30 countries in his career as an economist. Mr. Brusca was a Divisional Research Chief at the Federal Reserve Bank of NY (Chief of the International Financial markets Division), a Fed Watcher at Irving Trust and Chief Economist at Nikko Securities International. He is widely quoted and appears in various media. Mr. Brusca holds an MA and Ph.D. in economics from Michigan State University and a BA in Economics from the University of Michigan. His research pursues his strong interests in non aligned policy economics as well as international economics. FAO Economics’ research targets investors to assist them in making better investment decisions in stocks, bonds and in a variety of international assets. The company does not manage money and has no conflicts in giving economic advice.
More Economy in Brief
 Global| Feb 05 2026
Charts of the Week: Balanced Policy, Resilient Data and AI Narratives
by:Andrew Cates


