 Global| Jun 15 2021
EMU Trade Surplus Falls Sharply on Nonmanufacturing Weakness
Summary
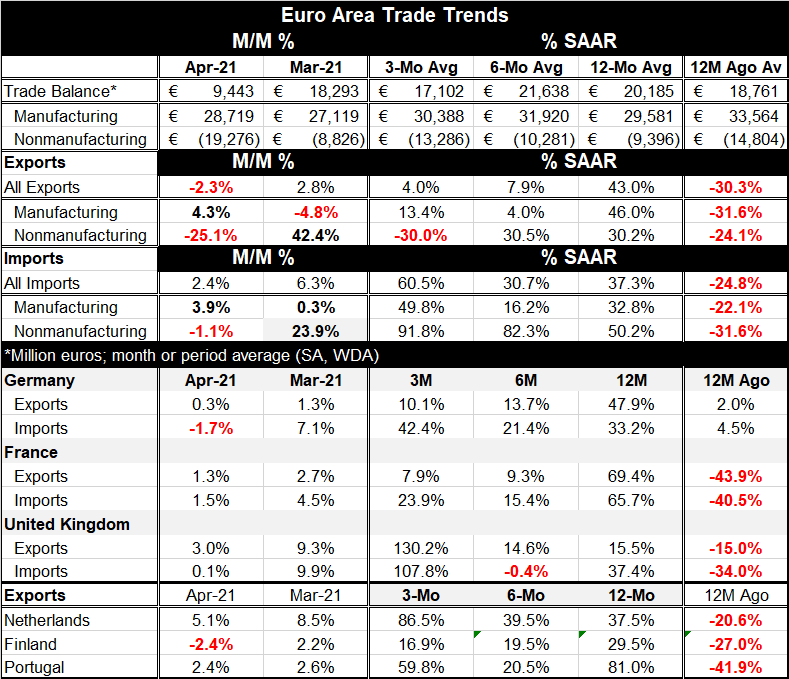
The EMU trade surplus fell very sharply nearly halving itself in one-month's time as it fell to €9.4bln in April from €18.3bln March. The balance on manufacturing trade in the EMU has been very stable; the surplus on that account rose [...]
 The EMU trade surplus fell very sharply nearly halving itself in one-month's time as it fell to €9.4bln in April from €18.3bln March.
The balance on manufacturing trade in the EMU has been very stable; the surplus on that account rose slightly in April to €28.7bln from €27.1bln. But for nonmanufacturing trade, the deficit in April swelled to €19.3bln from €8.8bln in March.
This violent move to a lager deficit on nonmanufacturing trade is a result of the sudden rise in oil prices and the gain in other commodity prices that have moved with oil. The simple correlation between Brent prices and the nonmanufacturing deficit in the EMU is -0.92, an extremely high negative correlation. This leaves little room for doubt that spurting commodity prices are the reason for the trade erosion. What happens with this deficit in the future will depend on the path of oil process. At the time of this report, Brent oil was at $65.16 (dollar-based pricing).
The manufacturing and nonmanufacturing trade balances in the EMU are negatively correlated. When manufacturing increases its surplus, nonmanufacturing usually increases its deficit as well and vice versa (another way to say this is that the two balances tend to grow and shrink together). The correlation between the two balances is -0.46 since December 2011; the R-squared relationship is a much smaller (in absolute value) 0.22.
All 12-month flows in the table are subject to a Covid base bias. One year ago Covid had struck and was hitting Europe hard. Because of this, all flows are up sharply from 12-months ago...exports, imports, manufactured goods and nonmanufactured goods all were affected the same. However, after that, trends go their own ways.
Over six months manufactures exports are up at a 4% pace; they are up at a 13.4% pace over three months. For manufactured imports, they are up at a 16.2% pace over six months and then up at a much stronger 49.8% pace over three months. From six-months to three-months, the manufactures surplus shrinks to €17.1 bln from €21.6bln. Meanwhile, the nonmanufactures deficit grows from six-months to three-months with its average rising to -€13.3bln over three months from -€10.3 bln. Movement in oil prices triggers shifting circumstances in the EMU trade positions.
Meanwhile, looking at several countries (EMU members Germany and France and no-longer-EU-member the U.K.), we find exports are slowing sequentially for both the EMU members Germany and France, but for the U.K. exports are erupting in strong growth over three months. On the import side flows from 12-months to six-months slow then accelerate for all three countries. And despite the strong 12-month gain due to the weak base in the year-ago Covid-affected period, both Germany and the U.K. have stronger import growth rates over three months than over 12 months.
Three other EMU members provide export data for this table. They show quite solid and strong export growth rates on all horizons but without any clear patterns. For the three countries, the Netherlands, Finland and Portugal, only Finland shows weak growth over the last two months on balance. All of them show firm to strong growth over three months, six months and 12 months. Finland alone shows a decelerating sequential pattern
Trade and manufacturing have been galloping back into place faster than services. In fact, the weakness in services has probably channeled more activity into the goods sector since people have not been able to engage in the service sector as much as in the past. But services are coming back on line and economies are headed for normalization even if full normalization is still a long way off. In the meantime, another element that is seeking to find a longer term equilibrium is oil prices. And with a stronger global focus on all things green, it is not clear exactly how that is going to work. A shift of demand to green sources should lower oil demand and prices, but a shift away from oil production will boost prices. For now the impact of the transition to green seems to be boosting oil prices.

Robert Brusca
AuthorMore in Author Profile »Robert A. Brusca is Chief Economist of Fact and Opinion Economics, a consulting firm he founded in Manhattan. He has been an economist on Wall Street for over 25 years. He has visited central banking and large institutional clients in over 30 countries in his career as an economist. Mr. Brusca was a Divisional Research Chief at the Federal Reserve Bank of NY (Chief of the International Financial markets Division), a Fed Watcher at Irving Trust and Chief Economist at Nikko Securities International. He is widely quoted and appears in various media. Mr. Brusca holds an MA and Ph.D. in economics from Michigan State University and a BA in Economics from the University of Michigan. His research pursues his strong interests in non aligned policy economics as well as international economics. FAO Economics’ research targets investors to assist them in making better investment decisions in stocks, bonds and in a variety of international assets. The company does not manage money and has no conflicts in giving economic advice.
More Economy in Brief


