 Global| Sep 04 2013
EMU Service Sector Is on the Mend
Summary
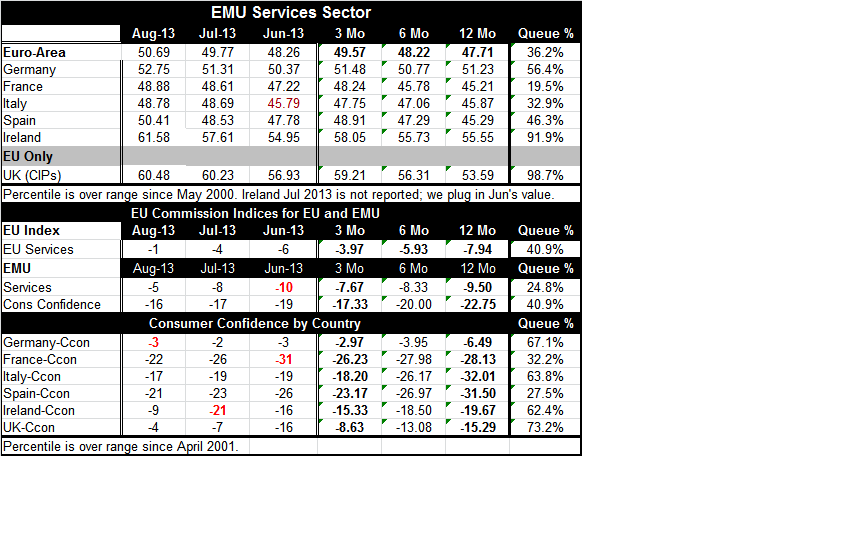
The services sector in the European monetary union crossed over to register growth at 50.69 in August. It was the first reading above 50 in 18 months signaling the first increase in the services sector in the European monetary [...]
 The services sector in the European monetary union crossed over to register growth at 50.69 in August. It was the first reading above 50 in 18 months signaling the first increase in the services sector in the European monetary Union...sort of...
Fallacy of composition: The lexicon of `growth' versus `shrinkage' for EMU applies to a weighted average concept for the Monetary Union. The overall value for the union is a country by country weighting of the individual member results. While every member does not report separate data upfront, in August France and Italy continue to post readings that are below 50 indicating that the service sectors in those countries continue to shrink. However, all the reporting countries showed improvements in July and in August even if that improvement did not take them all into territory that indicated expansion.
Luck of the Irish or policy? Over 12 months the biggest increase among the countries in the table comes from Ireland with a gain of 9.9 points in its diffusion index that's followed by a gain of 6.82 points in the UK. In turn, that's followed closely by Spain, with a net gain of 6.45. Italy made a gain a 4.77 points over 12 months, and Germany has a gain a 4.45 points over 12 months. Alone among these countries is France, with a small decline in its index over 12 months of just 0.33 points. What we see from these data is that over 12 months the UK is pretty much moving with or ahead of the speed of the Eurozone, as most e-Zone countries seem to be showing significant gains - France being the exception.
Performance in the cycle: When we evaluate the service sectors by asking which country still is the farthest away from its cycle peak the answer is France which is short of it cycle peak by 14 diffusion points compared to the European monetary union average of -6 points. Ireland is at its cycle peak. Ireland also has the sharpest gain from its cycle low where it's up form that low by 17 diffusion points. Spain is up by 14 points from its cycle low. Not surprisingly, France is up by only four points from its cycle low and is showing the weakest performance among the countries in the table.
An absolute standard for progress falls short: The disappointing news that's fairly uniform in this table is that despite the improved levels of the diffusion indices for the various nations' services sectors, the position that they have gained remains one that is weak by historic standards. The queue percentile standings show that the euro-Area itself is in the 36 percentile of its historic queue implying that is weaker than this only 36% of the time. Among EMU countries only Germany and Ireland are above their 50 percentile marks of their ordered queues which means that they are above their period midpoints. Ireland is extremely strong at nearly its 92nd percentile while Germany is in the 56 percentile of its historic queue. Lagging behind again is France in only the 19.5th percentile of its historic queue - France is weaker than this only 20% of the time. UK which is not a member of the common currency union has its service sector in the 98.7 percentile of its historic queue - nearly the strongest value since April of 2001.
Comparisons with the EU Commission net diffusion indices: We also present in the table below the percentile standings for the EU and EMU for their services indices using the European Commission Indices. That treatment shows that for the Monetary Union the European Commission indices are slightly weaker as the current reading in that scheme of -5 stands in the 25th percentile of its range, below the 36 percentile in the Markit PMI framework.
Consumer confidence and services: The queue standings on consumer confidence show rough correspondence to the standings in the service sector - better for some countries than for others, at least.. The UK has the relative strongest queue reading on consumer confidence in the 73rd percentile followed by Germany in the 76 percentile. Germany and UK have relatively high queue standings for their respective services sectors, too. Italy's confidence in the 63rd percentile, however is twice its percentile standing for services. Ireland's 62nd percentile standing for confidence lags behind is 91 percentile standing for Services. Spain at the 27th percentile for confidence lags behind in the 46th percentile standing for Services. France is only slightly above the 32nd percentile for confidence while its service sector metric lags in its 19th percentile. . Clearly both confidence and the condition of the service sector are left wanting in most cases. However consumer confidence in general seems to be doing slightly better than the service sector readings for the Monetary Union, suggesting that the service sector is lagging, not leading the recovery. In some cases something else is responsible for elevating consumer confidence.
Context, context, context: normalcy? While the European Monetary Union has not yet attained readings of normalcy in terms of confidence in the services sector, we do see that there is momentum and improvement. In order to say that they've "reached normalcy" we need to see the overall EU and EMU readings plus the readings of `most' countries reside somewhere above the 50th percentile of their historic queue rankings. The 50th percentile is a pretty low hurdle for the queue rankings. As far as the PMI readings themselves go, "50" is glorified as the point above which growth is signaled and below which contraction is signaled. In the percentile readings 50% occurs literally at the midpoint of the distribution of all PMI values. Since most economies grow over time the queue percentile reading gives you a better sense of where things have to be in order for us to be in some state of normalcy (where normalcy means you are in the upper region where the economy is `half the time better', not `half the time worse'). In order to "be normal" we need to be in the upper part of the distribution for the measure that we are looking at. That's a pretty minimal criterion- and one that we still fail to reach for the most part. It's like making a "C": on an exam at the 50% mark.
Diffusion value vs. queue standings: confidence In general since over time there is growth we would expect the 50th percentile position to reside above the diffusion reading of "50" or the net diffusion reading of "zero," the latter being the neutral point for EU Commission type indices that measure the net `up minus net down' responses. In fact what we see in the table is that, for example, in the case of Germany, consumer confidence is in the 67th percentile of its queue but with the `raw' diffusion reading for August still not signaling a net positive, at -3. Minus three? In this case I would point out that regardless of what the PMI lexicon is, the reading of -3 in Germany is one that is exceeded only about one third of the time. So however the confidence index is constructed the notion that zero would be neutral doesn't seem to be correct. Germans must simply be a sort of pessimistic bunch. In order to get more of them saying that things are getting better rather than worse you need to have conditions that are quite good indeed. At a value where conditions are better less than one-third of the time the net German response is still on balance negative!
We can notice the same is true in Italy with a -17 reading that is in the 64th percentile of its queue; in Ireland a reading of -9 is in the 62nd percentile; in the UK a -4 reading is in the 73rd percentile of its queue. We think that the queue data actually tell us more about what the consumer confidence numbers mean than the raw readings from the consumer confidence surveys themselves.
Diffusion value vs. queue standings: services Applying the queue reading interpretation to the PMI reading for the services sectors, we see, for example, that the reading for the euro area above 50, at a level of 50.69, is still only in the bottom 36 percentile of its queue- the sector is expanding but it is still WAY SHORT OF NORMAL. For Germany a reading of 52.75 resides in the 56 percentile of its queue - thus the queue and the raw diffusion readings are not too different at least in this neighborhood of values. For France, the diffusion reading seems quite close to 50 at 48.88, still, it resides in the bottom 20th percent of its historic queue. It seems France is used to much higher levels in its service sector. Indeed, over this period France's service sector tends to have the highest reading averaging 54.03 compared to Germany that averages 52.07. Spain averages 49.18, and has the weakest average among the countries in this table. Only Germany, Spain, the UK and Ireland have current readings that are above their averages for the period back to April 2001. (some of these are still below their medians with a queue standing below 50%) The Monetary Union itself posts a value above 50 but is still some 2.5 percentage points below its average.
That goes part of a way to explaining why its queue reading remains weak. Europe is doing better but still has a long way to go.

Robert Brusca
AuthorMore in Author Profile »Robert A. Brusca is Chief Economist of Fact and Opinion Economics, a consulting firm he founded in Manhattan. He has been an economist on Wall Street for over 25 years. He has visited central banking and large institutional clients in over 30 countries in his career as an economist. Mr. Brusca was a Divisional Research Chief at the Federal Reserve Bank of NY (Chief of the International Financial markets Division), a Fed Watcher at Irving Trust and Chief Economist at Nikko Securities International. He is widely quoted and appears in various media. Mr. Brusca holds an MA and Ph.D. in economics from Michigan State University and a BA in Economics from the University of Michigan. His research pursues his strong interests in non aligned policy economics as well as international economics. FAO Economics’ research targets investors to assist them in making better investment decisions in stocks, bonds and in a variety of international assets. The company does not manage money and has no conflicts in giving economic advice.
More Economy in Brief


