 Global| Jun 16 2010
EMU Rate Is Tepid On The Month But Headline Rate Continues Trend Acceleration
Summary
The inflation picture looks worse than the inflation reality. The chart above shows headline inflation seemingly 'soaring' off to the races running at a 1.6% Yr/Yr pace. Notice the scale and the push is a bit less daunting. For 3-mo [...]
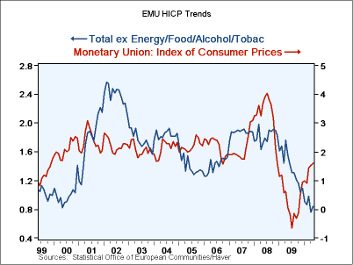 The inflation picture looks worse than the inflation reality. The chart
above shows headline inflation seemingly 'soaring' off to the races
running at a 1.6% Yr/Yr pace. Notice the scale and the push is a bit
less daunting. For 3-mo headline inflation the pace is at 2% which is
the ECB's speed limit. But in reality inflation's upsurge has all been
due to a push from oil prices that has sent goods prices soaring at 9%
annual rate over three-months. Oil has since stabilized. Service sector
inflation is hovering between 1% and 1.5%.
Moreover, core inflation in the zone is steady and low. The core rate is at 0.9% Yr/Yr and has accelerated to 1.4% over three months as energy prices have spurted. But there is no steady acceleration involved nor does the Euro-economy look like it is overheating- far from it.
The euro-area however is still growing. There is not serious sign of an economic set-back. Yet forward-looking confidence indicators have begun to crumble as UK consumer confidence fell by 10 points, and the Zew readings for Germany and Switzerland each have taken a giant step backward on the weakness in their expectations components. Still the Zew current reading for Germany continued to advance as expectations were slashed back sharply.
On balance it is not a situation that seems very hospitable to inflation. Current trends do not look that daunting; the environment is not inflation friendly. The sole inflation rating force in the Zone is the ongoing weakness in the euro itself and for that to become an issue the zone will have to get much stronger.
| Trends in HICP | |||||||
|---|---|---|---|---|---|---|---|
| % mo/mo | % saar | ||||||
| May-10 | Apr-10 | Mar-10 | 3Mo | 6Mo | 12Mo | Yr Ago | |
| EMU | 0.0% | 0.1% | 0.4% | 2.0% | 1.6% | 1.6% | 0.0% |
| Core | 0.2% | 0.0% | 0.2% | 1.4% | 0.8% | 0.9% | 1.5% |
| Goods | 0.1% | 0.8% | 1.4% | 9.9% | 3.3% | 1.9% | -1.4% |
| Services | 0.1% | 0.0% | 0.2% | 1.1% | 2.0% | 1.3% | 2.1% |
| HICP | |||||||
| Germany | 0.1% | -0.2% | 0.6% | 1.9% | 1.1% | 1.2% | 0.0% |
| France | -0.1% | 0.1% | 0.2% | 0.7% | 2.1% | 1.9% | -0.3% |
| Italy | -0.1% | 0.5% | 0.3% | 2.6% | 1.7% | 1.6% | 0.8% |
| UK | -0.2% | 0.5% | 0.4% | 2.9% | 4.0% | 3.4% | 2.2% |
| Spain | 0.1% | 0.0% | 0.3% | 1.7% | 1.0% | 1.8% | -0.9% |
| Core:xFE&A | |||||||
| Germany | 0.4% | -0.5% | 0.4% | 1.1% | 0.4% | 0.6% | 1.2% |
| France | 0.1% | -0.1% | 0.0% | -0.1% | 0.9% | 0.8% | 1.5% |
| Italy | -0.1% | 0.5% | 0.3% | 2.6% | 1.3% | 1.5% | 1.9% |
| UK | 0.1% | 0.3% | 0.4% | 2.9% | 3.1% | 2.8% | 2.1% |
| Spain | 0.2% | -0.2% | 0.1% | 0.4% | -0.4% | 0.3% | 0.9% |
Robert Brusca
AuthorMore in Author Profile »Robert A. Brusca is Chief Economist of Fact and Opinion Economics, a consulting firm he founded in Manhattan. He has been an economist on Wall Street for over 25 years. He has visited central banking and large institutional clients in over 30 countries in his career as an economist. Mr. Brusca was a Divisional Research Chief at the Federal Reserve Bank of NY (Chief of the International Financial markets Division), a Fed Watcher at Irving Trust and Chief Economist at Nikko Securities International. He is widely quoted and appears in various media. Mr. Brusca holds an MA and Ph.D. in economics from Michigan State University and a BA in Economics from the University of Michigan. His research pursues his strong interests in non aligned policy economics as well as international economics. FAO Economics’ research targets investors to assist them in making better investment decisions in stocks, bonds and in a variety of international assets. The company does not manage money and has no conflicts in giving economic advice.


