 Global| Apr 23 2012
EMU PMIs Say Brace For Worse Times Ahead! While the IFO's Reading & EC readings Say Markit's PMIs Are Too Dismal
Summary
Perspective on the Markit PMIsThe Markit PMI readings were not so surprising this month as the have been falling for some time There had been a three -month period in which the drop subsided, but that now is a thing of the past and [...]
 Perspective on the Markit PMIs
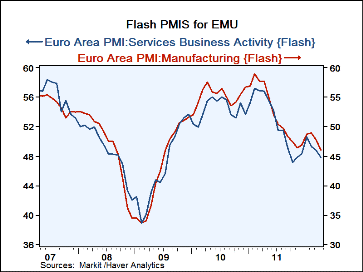
The Markit PMI readings were not so surprising this month as the have been
falling for some time There had been a three -month period in which the drop subsided, but that now is a thing of the past
and the PMI is back to falling with the MFG index on a new low and services eroding at a relatively rapid pace again.
The strip table shows us what the current readings mean. Gauging from history the MFG reading is weaker than its current value only 8.4% of the time. The services reading is weaker only 9.6% of the time.
Positioned in their ranges the two indices fair better as the MFG index stands in the 46th percentile of its range and services stand in the 37th percentile of its range.
So the services reading which is higher, stands at a lower position relative to his hi-low history but when placed in a queue of values it is slightly less weak than the MFG reading this month. Part of the reason for this is revealed by the averages for the two series as when we evaluate them relative to their own range or queue of observations the services index is graded harder having a higher average at 53, compared to 51.4 for manufacturing. Manufacturing is simply more variable, on average weaker and ranges over a broader span of values while the services sector is more prone to growth. Since January 2000 the MFG sector has registered a contraction 51 times compared to only 32 times for the services measure.
Even so this month the measures are both are contracting and both have been contracting steadily since September of last year with one exception, the service sector registered one month of expansion in January of 2012 before going back down for the count.
This month we are going to look beyond these PMI results to ask some questions about Germany. Germany is the lynch pin of Europe: as goes Germany so goes the Euro Area...Well not exactly! But to put it another way if Germany is not going up it's all but certain that the Euro Area is not. Right now most of the Euro Area is doing badly but the German economy results have been better than those of the Zone. Fair enough. But what is not exactly ‘fair enough' is that the vaunted German IFO index has come unglued from the market PMI index for Germany. The German IFO Index is from Mars and the PMI is from Uranus. Which is right?
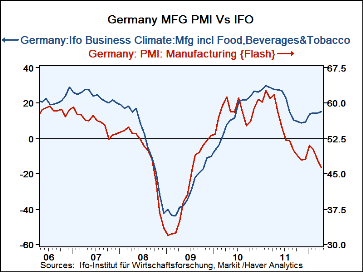
 German PMI compared to the IFO readings:The chart of the German MFG PMI Vs the MFG climate index in the IFO shows the
growing disparity between the two measures. And as the PMI is plunging faster, the IFO index for MFG is mounting a recovery.
There is a world of difference here. But let's let some statistics do the talking as well.
The statistical correlation between the MFG IFO climate index and the market PMI MFG index is 0.87, the R-square is 0.765. Those metrics indicate a high degree of correlation. But if we look at what the PMI reading implies for the IFO, estimating a statistical relationship, we find that IFO/PMI divergence is the second largest it has ever been since1996.
The IFO/PMI readings are at an unusual gap. And since June of last year many of the recent observations are at historically large divergences between the two series. This is not just the product of one bad observation. The last 10 observations average a ranking of seven, as in the seven largest errors/divergences in the history on these two series. If we had all the top errors in these 10 observations the average rank would be 5.5. In other words there is a real disconnect that has come between the IFO and the PMI methodologies and surveys for Germany.
For the German services sector there is also a big discrepancy. The gap between the current PMI service index for Germany and the IFO was only larger at the inception of the IFO index. If we cut out the first six observations from the launch of the PMI service index the recent observations over the last nine months average the eighth worst (our of 125 observations). The current month's gap is the fourth worst, the gap from February is the third worst, the gap from July of last year is the second worst… The services index has gone badly off track too.
We have no way of setting a priority on one measure as superior to the other. But this divergence is disturbing and it leaves us wondering which if either of the series is telling us what is really going on.
 Discriminating:
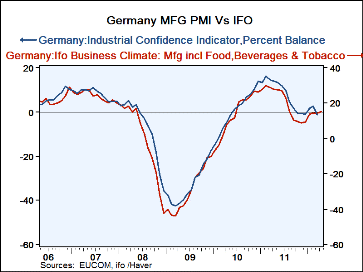
One thing we can do is to appeal to third index to see if it supports one of the two existing signal. And we have another such
pair of indices from the EC Commission.
If we run the same analysis and look at the EC measures of Services and MFG Vs the German IFO indicators we find that EC measures have a closer correlation to the German sectors and that they haven't ‘gone off track recently as have the Markit gauges.
It therefore appears that the market indices give a too pessimistic view of what is going on in Germany.
Two of the three measures show the same sorts of things in train in MFG and in services. Only the Markit index shows this severe weakness. The EC measures for services and MFG simply continue to track the IFO sector indices for Germany with the same, close relationship.
So maybe Germany does continue to hang in there better than the PMI gauges seem to say? Certainly the EC measure and the IFO survey are more in line with what we see from German consumer confidence indicators, German employment indicators and the like. Being somewhat skeptical of the recent Markit PMI weakness makes some sense. The Markit gauges appear to have taken on an overly pessimistic tone, at least for Germany.
| FLASH Readings | ||
|---|---|---|
| Markit PMIs for the Euro Area | ||
| MFG | Services | |
| Apr-12 | 45.99 | 47.85 |
| Mar-12 | 47.72 | 49.20 |
| Feb-12 | 48.96 | 48.85 |
| Jan-12 | 48.78 | 50.45 |
| Segment Averages | ||
| 3-Mo | 48.49 | 48.65 |
| 6-Mo | 47.64 | 48.77 |
| 12-Mo | 49.86 | 50.12 |
| 159-Mo Range | ||
| High | 60.47 | 62.36 |
| Low | 33.55 | 39.24 |
| % Range | 46.2% | 37.2% |
| range: | 26.92 | 23.12 |
| AVERAGE | 51.40 | 53.55 |
| Queue % | 8.4% | 9.6% |
Robert Brusca
AuthorMore in Author Profile »Robert A. Brusca is Chief Economist of Fact and Opinion Economics, a consulting firm he founded in Manhattan. He has been an economist on Wall Street for over 25 years. He has visited central banking and large institutional clients in over 30 countries in his career as an economist. Mr. Brusca was a Divisional Research Chief at the Federal Reserve Bank of NY (Chief of the International Financial markets Division), a Fed Watcher at Irving Trust and Chief Economist at Nikko Securities International. He is widely quoted and appears in various media. Mr. Brusca holds an MA and Ph.D. in economics from Michigan State University and a BA in Economics from the University of Michigan. His research pursues his strong interests in non aligned policy economics as well as international economics. FAO Economics’ research targets investors to assist them in making better investment decisions in stocks, bonds and in a variety of international assets. The company does not manage money and has no conflicts in giving economic advice.
More Economy in Brief
 Global| Feb 05 2026
Charts of the Week: Balanced Policy, Resilient Data and AI Narratives
by:Andrew Cates


