 Global| Dec 12 2018
EMU Area IP Is Slowing But Still Growing; IP Makes Modest Rebound
Summary
EMU IP (total excluding construction) gained 0.2% in October after a 0.6% decrease in September. However, IP had gained strongly in August and that has helped to drive the three-month rate of growth to a 3.5% annual pace and to [...]
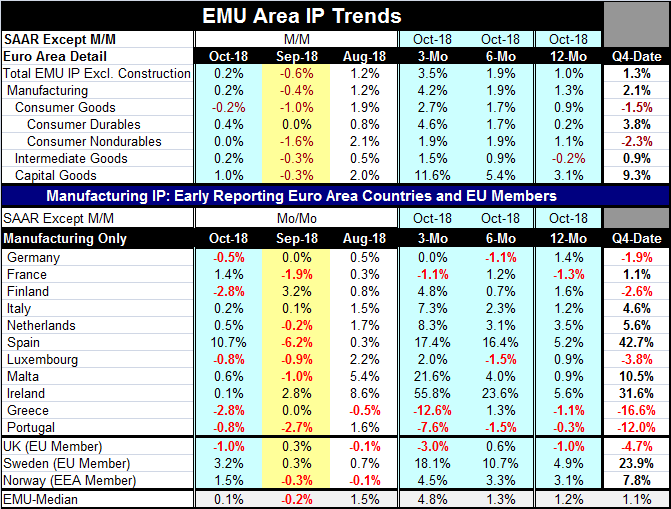
 EMU IP (total excluding construction) gained 0.2% in October after a 0.6% decrease in September. However, IP had gained strongly in August and that has helped to drive the three-month rate of growth to a 3.5% annual pace and to establish an accelerating profile for output from 12-months to six-months to three-months. Still, the patterns of gains over the last three months belie any notion that IP is simply gathering a head of steam. In the quarter-to-date (see Q4-Date), IP is up at only a 1.3% annual rate, below its three-month and six-month rates of growth.
Manufacturing IP shows much the same results and patterns with a 0.2% rise in October after a 0.4% decline in September.
However, sector results for consumer goods, intermediate goods and capital goods all show growth rates accelerating from 12-months to six-months to three-months. And all sectors show drops in output in September with strong-to-solid gains in August. Capital goods also show a strong 1% rise in output in October while consumer goods show output falling by 0.2% in October marking two declines in a row despite its 'accelerating' trajectory. The lesson for those IP data is that trends can be difficult to characterize or to pin down.
In the quarter-to-date, manufacturing output is up at a solid 2.1% annual rate. Consumer goods output is falling at a 1.5% annual rate. Intermediate goods output is up at a mild 0.9% annual rate. But capital goods output is expanding at a hefty 9.3% annual rate early in the year's final quarter. Still, a look at the chart of year-on-year sector growth rates makes it clear that sector output trends broadly measured have been slowing down, not speeding up. And since year-over-year trends are very broad and relatively free from problems of 'seasonal adjustment,' their signal is to be preferred when signal conflict.
Among the 11-early EMU members in the table, five show declines in output in October. This is after six showed declines in September and two others were dead flat. That, however, followed an August that had only one country (Greece) with an output decline. The three-month growth rates find three members with output declines (France, Greece, and Portugal) with output flat in Germany. Spain, Malta, and Ireland post strong double-digit rates of growth in contrast. Over six months, Germany, Luxembourg, and Portugal log output declines as Ireland and Spain surge on double-digit rates of growth. Year-on-year overall manufacturing output in the EMU is up by 1.3%, the median for EMU members in this tables is up by 1.2% and only France, Greece and Portugal have 12-month output declines. All in all five countries have output changes of 1% or less and three have output changes of more than 2% over 12 months (the Netherlands, Spain, and Ireland).
The data obviously show a lot of cross currents whether arrayed by country or by sector. And the broad year-on-year trends point to an overall deceleration for output growth. Year-on-year trends by country confirm slowdowns in IP growth in Germany, France, Italy, and in the U.K. – all the largest European economics. Spain may also be in that mix. It isn't only because its extreme volatility makes it too hard to gauge its trend not because it clearly does not belong there.
 Trends also confirm broad slowing in train for intermediate goods and consumer goods. The bright spot is capital goods. It has run cycles of its own. Capital goods output boomed from early-2015 to mid-2016 then slowed its pace through early-2017. It accelerated into late-2017. Since then, it has been slowing, but the slowdown in capital goods output seems to have been arrested 4-6-months ago when the tailing of growth gave way to firmness around the 2% growth mark. Manufacturing output in the EMU is now at 99.4% of its past cycle peak. Capital goods output has reached a new peak. It is very consistent that with output having made a full recovery that capital goods output and investment would be firming or on an upswing.
Still, consumer goods and intermediate goods are lagging behind the performance of the capital goods sector. IP trends are actually still good-looking trends, especially in the face of the recent trends we see for the manufacturing surveys from Markit. Measured manufacturing output (as opposed to diffusion-based surveys) is growing and despite decelerating trends is also stabilizing as manufacturing PMI readings continue to weaken but have steadied above the key 50 boom-bust precipice. Nothing is pointing to declines in production, but there is a widespread slowing in place. Central bankers will have to exercise judgement as to whether this represents a state of stability or of fragility.

Robert Brusca
AuthorMore in Author Profile »Robert A. Brusca is Chief Economist of Fact and Opinion Economics, a consulting firm he founded in Manhattan. He has been an economist on Wall Street for over 25 years. He has visited central banking and large institutional clients in over 30 countries in his career as an economist. Mr. Brusca was a Divisional Research Chief at the Federal Reserve Bank of NY (Chief of the International Financial markets Division), a Fed Watcher at Irving Trust and Chief Economist at Nikko Securities International. He is widely quoted and appears in various media. Mr. Brusca holds an MA and Ph.D. in economics from Michigan State University and a BA in Economics from the University of Michigan. His research pursues his strong interests in non aligned policy economics as well as international economics. FAO Economics’ research targets investors to assist them in making better investment decisions in stocks, bonds and in a variety of international assets. The company does not manage money and has no conflicts in giving economic advice.
More Economy in Brief


