 Global| Aug 16 2004
Empire State Index Slows 23 Points for August
Summary
The Empire State Index of General Business Conditions in New York's manufacturing industries dropped 23 points in August to 12.6, its lowest reading in 15 months. The July figure was revised down slightly from 36.54 to 35.75. All of [...]
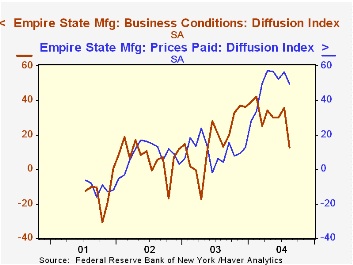
The Empire State Index of General Business Conditions in New York's manufacturing industries dropped 23 points in August to 12.6, its lowest reading in 15 months. The July figure was revised down slightly from 36.54 to 35.75.
All of the activity components of the survey showed significant reductions, particularly new orders and shipments. Unfilled orders registered -4.61, their first negative reading since September 2003. However, the employment measure managed a modest pick-up to 16.98 from 13.06 in July. Like the Philadelphia Fed Index of General Business Conditions, the Empire State Business Conditions Index reflects answers to an independent survey question; it is not a weighted combination of the components.
The prices paid index eased from 56.41 in July to 49.59. This is still relatively high, but maintains the general range of the last several months, indicating that prices of the materials used by these companies have stopped accelerating.
The August index of expectations for business conditions six months ahead decreased by about 5 points. Expectations for capital expenditures fell for a fourth consecutive month.
The Empire State Manufacturing Survey is a monthly survey of manufacturers in New York State conducted by the Federal Reserve Bank of New York. Participants from across the state in a variety of industries respond to a questionnaire and report the change in a variety of indicators from the previous month. Respondents also state the likely direction of these same indicators six months ahead. April 2002 is the first report, although survey data date back to July 2001.
For more on the Empire State Manufacturing Survey, including methodologies and the latest report, click here.
| Empire State Manufacturing Survey | August | July | 8/03 | 2003 | 2002 | 2001 |
|---|---|---|---|---|---|---|
| General Business Conditions (diffusion index) | 36.54 | 35.75 | 13.02 | 16.30 | 7.02 | -13.57 |
by Carol Stone August 16, 2004
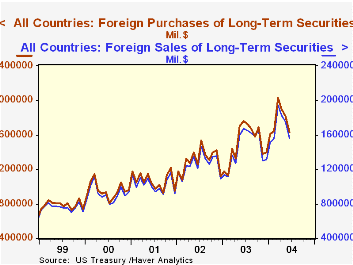
In June, net foreign purchases of securities traded in US markets totaled $71.8 billion, more than May's $65.9 billion. The latter figure, though, was revised upward from an original $56.4 billion. So there has been considerably more foreign activity in US securities markets of late. The US Treasury publishes the array of monthly data on foreign investors' purchases and sales of "long-term" US securities (having maturity greater than one year). Known as the "TIC" data for "Treasury International Capital", these data are contained in Haver's USINT database in the section "US International Investment Tables", shown by security type and country.
The performance of the net figure can give a somewhat misleading impression of outright demand for US securities, however. As indicated in the first graph, foreign investors actually bought fewer bonds and stocks in June. The gain in net purchases occurred because these investors also curtailed their sales.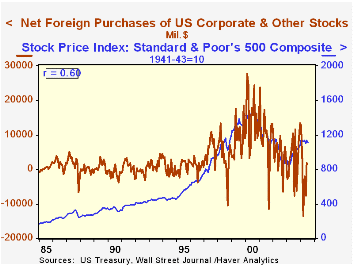
By security type, net purchases increased for Treasuries and bonds of US corporations. Purchases of federal agency securities fell, and foreign investors were net sellers of foreign bonds and foreign stocks in US markets. They moved from net sales of US corporate stocks to modest net purchases, ending a three-month-long net liquidation. It is seen in the second graph that this last development corresponds to the evolution of the US stock market. Net foreign purchases of stocks have a 60% correlation with the S&P 500 Index over the last 20 years. Here too, though, the "net purchases" occurred because sales fell by more than purchases, meaning this is not a genuinely positive commitment to the US markets.
| Net Foreign Purchases of Securities in US Markets (Billions US$) | June 2004 | May 2004 | Apr 2004 | June 2003 | Monthly Average|||
|---|---|---|---|---|---|---|---|
| 2003 | 2002 | 2001 | |||||
| Total | 71.8 | 65.2 | 75.4 | 92.9 | 59.2 | 47.9 | 41.8 |
| Treasuries | 40.6 | 29.2 | 35.7 | 46.9 | 23.2 | 10.0 | 1.5 |
| Federal Agencies (mostly "GSEs") | 15.9 | 20.6 | 31.8 | 31.1 | 13.4 | 16.3 | 13.7 |
| US Corporate Bonds | 27.1 | 20.3 | 16.5 | 23.0 | 22.5 | 15.2 | 18.5 |
| US Corporate Stocks | 1.9 | -7.7 | -1.9 | 10.4 | 2.9 | 4.2 | 9.7 |
| Foreign Bonds | -6.2 | 8.6 | 4.7 | 10.5 | 2.2 | 2.4 | 2.5 |
| Foreign Stocks | -7.5 | -5.8 | -11.3 | -5.2 | -5.9 | -0.1 | -4.2 |
by Carol Stone August 16, 2004
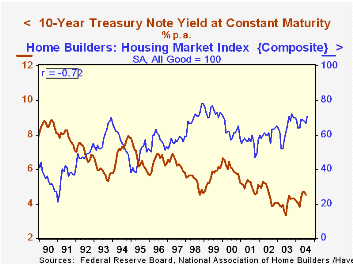
The Composite Housing Market Index reported by the National Association of Home Builders (NAHB) rebounded in this month's survey to 71, 4 points higher than in July. The index was even with last August's level.
The index of single family home sales expected in the next six months also rose 4 points. The current sales index gained 2 points.
After falling to a three-month low in July, the gauge of traffic of prospective buyers surged to 57, its highest in more than five years.
The fortunes of the housing market are widely viewed as related inversely to interest rates. This has generally been the case, with a negative correlation of 73% over the last 15 years between the Housing Market Index and the 10-year Treasury constant maturity yield. However, this relationship has broken down over more recent spans. Over the last 10 years, the correlation is only 38%, and it even swings to positive in the last five years. This behavior suggests that causation could be shifting the other way: that is, perhaps developments in housing demand are impacting interest rates so that as it strengthens, rates rise.
The NAHB index is a diffusion index based on a survey of builders. Readings above 50 signal that more builders view conditions as good than poor.Visit the National Association of Home Builders using this link.
| Nat'l Association of Home Builders | August | July | June | August '03 | 2003 | 2002 | 2001 |
|---|---|---|---|---|---|---|---|
| Composite Housing Market Index | 71 | 67 | 68 | 71 | 64 | 61 | 56 |
Carol Stone, CBE
AuthorMore in Author Profile »Carol Stone, CBE came to Haver Analytics in 2003 following more than 35 years as a financial market economist at major Wall Street financial institutions, most especially Merrill Lynch and Nomura Securities. She had broad experience in analysis and forecasting of flow-of-funds accounts, the federal budget and Federal Reserve operations. At Nomura Securities, among other duties, she developed various indicator forecasting tools and edited a daily global publication produced in London and New York for readers in Tokyo. At Haver Analytics, Carol was a member of the Research Department, aiding database managers with research and documentation efforts, as well as posting commentary on select economic reports. In addition, she conducted Ways-of-the-World, a blog on economic issues for an Episcopal-Church-affiliated website, The Geranium Farm. During her career, Carol served as an officer of the Money Marketeers and the Downtown Economists Club. She had a PhD from NYU's Stern School of Business. She lived in Brooklyn, New York, and had a weekend home on Long Island.
More Economy in Brief


