 Global| Jul 16 2007
Empire State Index Adds To June Surge
by:Tom Moeller
|in:Economy in Brief
Summary
The July index of manufacturing activity in New York State added slightly to the improvement in June. The Index of General Business Conditions rose 0.71 points on top of its 17.72 jump during June. Consensus expectations for the [...]
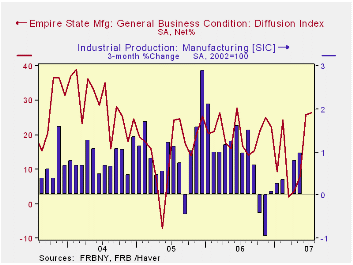
The July index of manufacturing activity in New York State added slightly to the improvement in June. The Index of General Business Conditions rose 0.71 points on top of its 17.72 jump during June. Consensus expectations for the Empire State index had been for a decline to a reading of 18.0. The figures are reported by the Federal Reserve Bank of New York.
Since the series' inception in 2001 there has been a 75% correlation between the index level and the three month change in U.S. factory sector industrial production.
The index for new orders improved slightly and the index for employment jumped. Conversely, the shipments index fell considerably as did inventories and the index & delivery times, each into negative territory.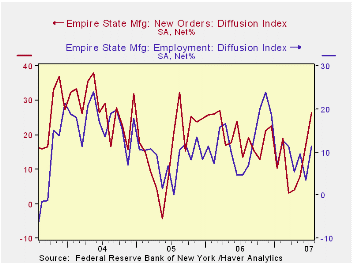
Like the Philadelphia Fed Index of General Business Conditions, the Empire State Business Conditions Index reflects answers to an independent survey question; it is not a weighted combination of the components.
Pricing pressure also fell considerably with the prices paid index and the prices received index falling into negative territory. Since 2001 there has been an 88% correlation between the index of prices paid and the three month change in the core intermediate materials PPI.
The Empire State index of expected business conditions in six months improved. The index of expected new orders led the gain to the highest level in over a year.
The Empire State Manufacturing Survey is a monthly survey of manufacturers in New York State conducted by the Federal Reserve Bank of New York. Participants from across the state in a variety of industries respond to a questionnaire and report the change in a variety of indicators from the previous month. Respondents also state the likely direction of these same indicators six months ahead. April 2002 is the first report, although survey data date back to July 2001.For more on the Empire State Manufacturing Survey, including methodologies and the latest report, click here.
| Empire State Manufacturing Survey | July | June | July. '06 | 2006 | 2005 | 2004 |
|---|---|---|---|---|---|---|
| General Business Conditions (diffusion index) | 26.46 | 25.75 | 20.33 | 20.33 | 15.62 | 28.70 |
by Tom Moeller July 16, 2007
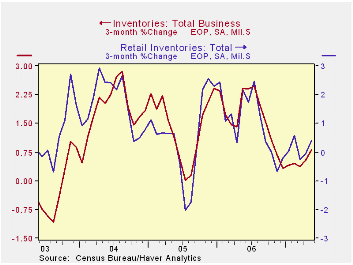
After deceleration through April, total business inventories in May rose 0.5% following a 0.4% increase the month prior. The increases were sufficient to raise the three month growth rates. Consensus expectations had been for a 0.3% one month rise.
Three month average growth in business inventories rose to 0.8%, its highest since last October.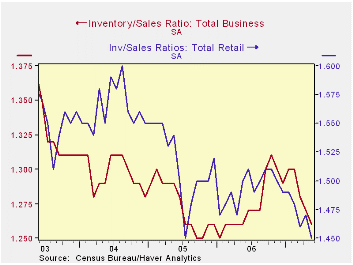
Retail inventories rose 0.6%, double the rise in April. General merchandise inventories halved their April rise with a 0.4% (6.6% y/y) but clothing store inventories surged 0.7% (8.1% y/y) after a 0.2% April decline. Furniture inventories fell 0.7% (-0.2% y/y) after no change during April. Auto inventories fell for the fourth straight month.
| Business Inventories | May | April | Y/Y | 2006 | 2005 | 2004 |
|---|---|---|---|---|---|---|
| Total | 0.5% | 0.4% | 4.0% | 5.9% | 6.2% | 7.9% |
| Retail | 0.6% | 0.3% | 1.6% | 3.2% | 2.8% | 6.8% |
| Retail excl. Autos | 0.7% | 0.4% | 4.3% | 4.5% | 4.5% | 7.2% |
| Wholesale | 0.5% | 0.3% | 6.7% | 8.6% | 7.4% | 9.7% |
| Manufacturing | 0.3% | 0.4% | 4.3% | 6.4% | 7.9% | 7.7% |
by Louise Curley July 16, 2007
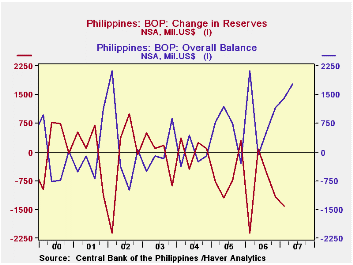
The Central Bank of the Philippines announced today that the "overall balance of payments" for June amounted to $834 million, $169 million above May and $602 million above June of last year. The overall balance of payments is defined by the Bank as equal to the change in reserve assets less the change in reserve liabilities.
Because of the identity underlying the balance of payments concept, the change in reserves is shown with its sign reversed in the balance of payments table. Thus in the Balance of Payments Table in the PHILIPPINE@EMERGEPR data base, the Change in Reserves has the opposite sign of the Overall Balance of Payments, as shown in the first chart. The Overall Balance is equal to the sum of the Current Account, the Capital and Financial Account and the Net Unclassified Items (Errors and Omissions). 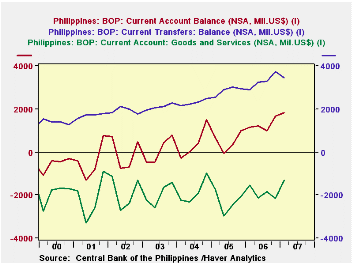
The Philippines balance on current account has shown a surplus, more often than not, since mid 2001. The improvement in the current account has been due mostly to remittances from citizens working abroad. The balance on trade in goods and services continues to be negative. The second chart shows the quarterly balance on current account together with the balance on trade in goods and services and the balance on transfers (largely workers' remittances). These data are available only through the first quarter of 2007.
| PHILIPPINE BALANCE OF PAYMENTS (Millions U. S. $) | Q1 07 | Q4 07 | Q1 06 | Q/Q Chg | Y/Y Chg | 2006 | 2005 | 2004 |
|---|---|---|---|---|---|---|---|---|
| Current Account | 1823 | 1676 | 1153 | 147 | 670 | 5022 | 1955 | 1628 |
| Capital and Financial Account | 154 | -825 | 1427 | 974 | -1185 | -1722 | 1661 | -1630 |
| Net Unclassified Items | -559 | 297 | -459 | -856 | -100 | 469 | -1206 | -278 |
| Overall Balance of Payments=Sum of above | 1418 | 1150 | 2121 | 268 | -703 | 3769 | 2410 | -280 |
| Change in Reserves | -1418 | -1150 | -2121 | -268 | 703 | -3769 | -2410 | 280 |
| Current Account | 1823 | 1676 | 1153 | 147 | 670 | 5022 | 1955 | 1628 |
| Goods and Services Balance | -1229 | -2147 | -1532 | 848 | 237 | -7624 | -9192 | -7461 |
| Net Transfer Balance | 3445 | 3747 | 2911 | -302 | 534 | 13189 | 11391 | 9160 |
| Jun 07 | May 07 | Jun 06 | M/M Chg | Y/Y Chg | 2006 | 2005 | 2004 | |
| Overall Balance of Payments | 834 | 665 | 232 | 169 | 602 | 3769 | 2410 | -280 |
| Change in Reserves |
by Robert Brusca July 16, 2007
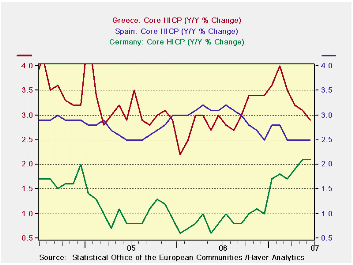
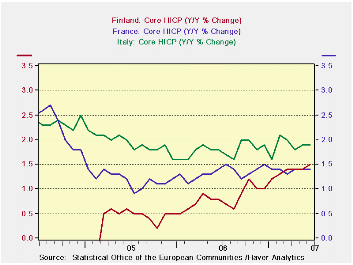
The chart on select core HICP readings violates the rule on how many lines to plot on a graph (sorry). But the clear message is that few of these are trending lower and most are trending up. Among those that have any trend lower, there is usually abysmally high inflation rate anyway (Greece and Spain, for example).
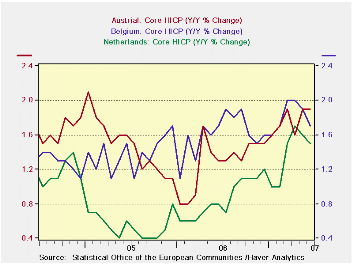
The table below presents the discernable detail on core inflation trends on data that were not available last week. The table shows that inflation is accelerating in too many countries for comfort. In the same table we slice the data into a number of 12-month periods ended in June since that is the most recent observation.
As of June 2007 inflation was accelerating in half of the select 12 EMU members. Over the past year inflation also was higher on a year/year basis in seven countries than it had been in June of 2004. Any way you look at the inflation comparisons there is a hint of inflation. And these data look at core prices excluding the direct effects of food and energy inflation. These four presentations, the chars and the table below, make it clear why the ECB remains wary about inflation forces.
Inflation is simply trending higher into many categories to be ignored and across too many EMU countries to assume that it will go down all by itself.
  |
| Jun-07 | Jun-06 | Jun-05 | Jun-04 | |
| Austria | 1.9% | 1.3% | 1.6% | 1.6% |
| Belgium | 1.7% | 1.7% | 1.4% | 1.3% |
| Finland | 1.4% | 0.8% | 0.6% | -0.4% |
| France | 1.4% | 1.4% | 1.2% | 2.5% |
| Germany | 2.1% | 0.8% | 0.8% | 1.8% |
| Greece | 2.9% | 3.0% | 2.9% | 3.6% |
| Ireland | 2.4% | 2.1% | 1.7% | 2.0% |
| Italy | 1.8% | 1.8% | 1.9% | 2.4% |
| Luxembourg | 2.3% | 2.3% | 2.5% | 2.7% |
| The Netherlands | 1.5% | 0.8% | 0.6% | 1.3% |
| Portugal | 2.4% | 2.5% | 0.2% | 3.9% |
| Spain | 2.4% | 3.1% | 2.5% | 2.9% |
| EMU Core HICP | 1.9% | 2.5% | 1.9% | 2.4% |
Tom Moeller
AuthorMore in Author Profile »Prior to joining Haver Analytics in 2000, Mr. Moeller worked as the Economist at Chancellor Capital Management from 1985 to 1999. There, he developed comprehensive economic forecasts and interpreted economic data for equity and fixed income portfolio managers. Also at Chancellor, Mr. Moeller worked as an equity analyst and was responsible for researching and rating companies in the economically sensitive automobile and housing industries for investment in Chancellor’s equity portfolio. Prior to joining Chancellor, Mr. Moeller was an Economist at Citibank from 1979 to 1984. He also analyzed pricing behavior in the metals industry for the Council on Wage and Price Stability in Washington, D.C. In 1999, Mr. Moeller received the award for most accurate forecast from the Forecasters' Club of New York. From 1990 to 1992 he was President of the New York Association for Business Economists. Mr. Moeller earned an M.B.A. in Finance from Fordham University, where he graduated in 1987. He holds a Bachelor of Arts in Economics from George Washington University.
More Economy in Brief
 Global| Feb 05 2026
Charts of the Week: Balanced Policy, Resilient Data and AI Narratives
by:Andrew Cates


