 Global| Jun 15 2009
Empire State Factory ConditionsDeteriorated M/M But Remain Improved From Earlier Low
by:Tom Moeller
|in:Economy in Brief
Summary
This month's Empire State Index of manufacturing sector activity, reported by the Federal Reserve Bank of New York, fell versus May. Nevertheless, the latest reading remained very much improved from the low of this past Winter and, as [...]
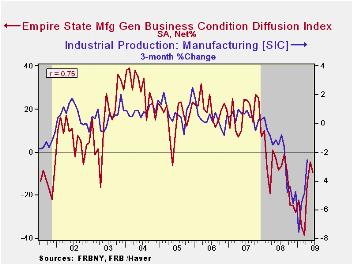 This
month's Empire State Index of manufacturing sector activity, reported
by the Federal Reserve Bank of New York, fell versus May. Nevertheless,
the latest reading remained very much improved from the low of this
past Winter and, as a result, suggests that recessionary forces have
moderated. The reading of -9.41 compared with -4.55 in May. The index
reached a level of -38.23 this past March and the latest level compared
to Consensus expectations for a reading of -4.5.
This
month's Empire State Index of manufacturing sector activity, reported
by the Federal Reserve Bank of New York, fell versus May. Nevertheless,
the latest reading remained very much improved from the low of this
past Winter and, as a result, suggests that recessionary forces have
moderated. The reading of -9.41 compared with -4.55 in May. The index
reached a level of -38.23 this past March and the latest level compared
to Consensus expectations for a reading of -4.5.
The Empire State Manufacturing Survey is a monthly survey of manufacturers in New York State. Participants from across the state in a variety of industries respond to a questionnaire and report the change in indicators from the previous month. Respondents also state the likely direction of these same indicators six months ahead. For more on the Empire State Manufacturing Survey, including methodologies and the latest report, click here.
The figure is a diffusion index. Since the series' inception
in 2001,
there has been a 75% correlation between its level and the three-month
change in U.S. factory sector industrial production. Like the
Philadelphia Fed Index of General Business Conditions, the Empire State
Business 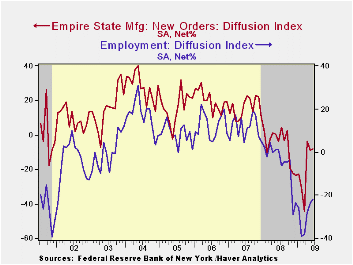 Conditions Index reflects answers to independent survey
questions; it is not a weighted combination of the components. The
series dates back only to 2001.
Conditions Index reflects answers to independent survey
questions; it is not a weighted combination of the components. The
series dates back only to 2001.
Deterioration in the component of the June survey was limited to shipments and inventories. Otherwise, the new orders index improved modestly to -8.15 and that compares to March's reading of -44.76. Twenty-five percent of survey participants reported higher new orders, versus the March low of nine percent. The employment index also improved to the highest level since last October. Fourteen percent of respondents reported higher employment versus the March low of 4.5%. In the history of the NY employment index, there has been an 87% correlation between it and the three-month growth in overall U.S. factory sector employment as reported by the Labor Department. The length of the average workweek also grew.
Price
deflation also moderated as the rate of contraction in the factory
sector slowed. The price index rose to its highest level since late
last year as the number of respondents reporting lower prices fell
sharply to 16%,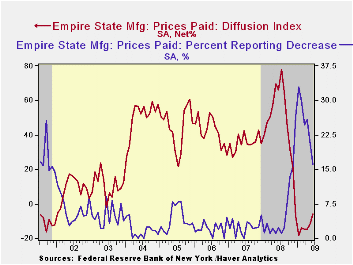 half of the percentage of this past January. Only 10%
of respondents reported paying higher prices and that was near the
series' low. Since inception in 2001, there has been a 76% correlation
between the index of prices paid and the three-month change in the core
intermediate materials PPI.
half of the percentage of this past January. Only 10%
of respondents reported paying higher prices and that was near the
series' low. Since inception in 2001, there has been a 76% correlation
between the index of prices paid and the three-month change in the core
intermediate materials PPI.
The Empire State index of expected business conditions in six months improved during June to the highest level since mid-2007. The subseries for shipments, employment and capital expenditures jumped while prices paid and new orders remained off their lows.
The Empire State data is available in Haver's SURVEYS database.
Large Banks and Small Banks in an Era of Systemic Risk Regulation is this morning's speech by Fed Governor Daniel K. Tarullo and it can be found here.
| Empire State Manufacturing Survey | June | May | June '08 | 2008 | 2007 | 2006 |
|---|---|---|---|---|---|---|
| General Business Conditions (diffusion index, %) | -9.41 | -4.55 | -8.12 | -10.10 | 17.23 | 20.24 |
| New Orders | -8.15 | -9.01 | -3.73 | -6.25 | 15.71 | 20.11 |
| Employment | -21.84 | -23.86 | 1.16 | -5.36 | 11.28 | 12.62 |
| Prices Paid | -5.75 | -11.36 | 66.28 | 46.99 | 35.64 | 41.88 |
by Tom Moeller June 15, 2009
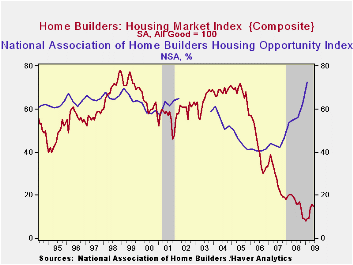
According to the National Association of Home Builders, the recent improvement in the housing market took this month off. Their June index of sales slipped to 15 from the unrevised May level of 16. Nevertheless, the index remained near the highest level since last September. The index is compiled from survey questions asking builders to rate market conditions as “good”, “fair”, “poor” or “very high” to “very low”. Numerical results over 50 indicate a predominance of “good” readings.
During the first quarter the Home Builders' Housing
Opportunity Index, which is the share of homes sold that could be
considered affordable to a family earning the median income, jumped m/m
to a record high buoyed by lower home prices, lower interest rates and
higher income. (There is a break in the series from 2002 to 2003.)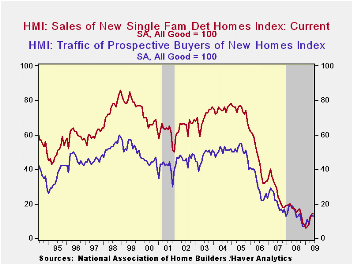
The Home Builders Association indicated that its sub-index of present sales remained stable at a reading of 14 but that also was up significantly from the low of last year. Since 1990, the year-to-year change in this index has had an 80% correlation with the year-to-year percentage change in new single-family home sales.
The index of builders’ expectations for home sales in six months also slipped but remained near its highest since September. The “traffic" of prospective buyers was unchanged from May and still up from the record lows of this past Winter.
During June the index readings for each of the county's regions improved except in the South.
The NAHB has compiled the Housing Market Index since 1985. The weights assigned to the individual index components are .5920 for single family detached sales, present time; .1358 for single family detached sales, next six months; and .2722 for traffic of prospective buyers. The results, along with other housing and remodeling indexes from NAHB Economics, are included in Haver’s SURVEYS database.
| Nat'l Association of Home Builders | June | May | June '08 | 2008 | 2007 | 2006 |
|---|---|---|---|---|---|---|
| Composite Housing Market Index (All Good = 100) | 15 | 16 | 18 | 16 | 27 | 42 |
| Single-Family Sales | 14 | 14 | 17 | 16 | 27 | 45 |
| Single-Family Sales: Next Six Months | 26 | 27 | 27 | 25 | 37 | 51 |
| Traffic of Prospective Buyers | 13 | 13 | 16 | 14 | 21 | 30 |
by Robert Brusca June 15, 2009
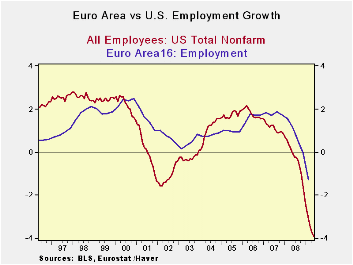
The number of people at work in the Euro Area fell by 1.2mln
in Q1, the greatest quarterly drop since records began in 1995. Still,
that performance is dwarfed by the huge declines in the US as the
percentage calculations in the table show.
Europe has been hurt badly but it is a region with far more
labor market rigidities than the US. And those rigidities help
employment during times of economic shocks. Employment in the Euro Area
is down by just 1.3% Yr/Yr and unemployment is up by 20.9%. Compare
that to the US where employment is down by 3.1% Yr/Yr and unemployment
is up by 63% Yr/Yr. But even with those figures the ratio of the
unemployed-to-employed is greater in the Euro Area than in the US. The
fact is simply that the US unemployment rate was much lower than
Europe’s before recession and now it has ticked up to the same general
region as Europe’s rate.
Obviously the structure of the economy in Europe and in the US
is very different. Still this recession has hit Europe hard. By its own
metrics the labor market has been hit hard. The US is looking at one of
its most severe recessions in the Post-war period. EMU has not been
around long enough to make any such statement.
Through 2009-Q1 both EMU and the US are showing signs of an
increased pace of job losses and an increased pace of unemployment.
Monthly data in the US strongly support the notion that the
unemployment mess is unwinding rapidly in Q2. At this pace of unwind
the US could have job growth by August of 2009. We have no such bright
future in hand for Europe.
While there is still a debate afoot about the US and whether
it will spawn a strong or weak recovery, we can be sure that Europe’s
will be slow in part because of all the disguised unemployment its
labor force rigidities hide. Forecasts still foresee weak growth for
the rest of the year in Europe. For the US that same forecast generally
is in place but conditions in the US are shifting pretty fast and some
forecasts have simply not been recast. Europe does not shift gears fast.
We can’t judge the recession to be than much harsher in the US
than in Europe because of the jobs data and the greater US labor force
displacement. There are simply different economic structures at work.
But the figures are telling in terms of the impact on jobs in both EMU
and in the US. GDP has been hard hit in both regions. In the US the GDP
downturn simply dislodges more jobs. US GDP has fallen by about 6%
(SAAR) for two quarters a row. In EMU the drops have been more like 7%
and 10% at annual rates. Clearly jobs don’t tell the whole story of
dislocation.
| Growth rates by Quarter or period for various EU Nations | |||||||
|---|---|---|---|---|---|---|---|
| Saar: All | Q1-09 | Q4-08 | Q3-08 | Q2-08 | 2Qtr | 4Qtr | 5Yr |
| All Employed: EMU | -3.3% | -1.4% | -0.7% | 0.2% | -2.3% | -1.3% | 0.9% |
| No Unemployed | 39.9% | 26.6% | 12.0% | 7.8% | 33.0% | 20.9% | 0.5% |
| EA: Industry | -5.3% | -3.9% | -1.7% | -0.8% | -4.6% | -2.9% | -0.8% |
| EA: Agric, Forestry | -2.5% | 0.8% | -2.2% | -5.5% | -0.8% | -2.4% | -1.3% |
| EA: Construction | -8.6% | -8.7% | -5.8% | -4.6% | -8.6% | -6.9% | 0.6% |
| EA: Wholesale Retail | -3.8% | -1.5% | -0.2% | 0.3% | -2.7% | -1.3% | 1.0% |
| EA: Financial | -3.9% | -2.2% | 0.3% | 0.9% | -3.1% | -1.3% | 2.5% |
| EA: Gov't Education | 0.0% | 2.2% | 0.5% | 2.5% | 1.1% | 1.3% | 1.4% |
| Memo: Industry Employment | |||||||
| Germany | -3.8% | -0.1% | 0.2% | 1.0% | -2.0% | -0.7% | -0.2% |
| UK (MFG)* | #N/A | -6.6% | -6.3% | -2.0% | -6.5% | -4.0% | -3.4% |
| France (MFG) | -5.8% | -3.3% | -1.6% | -1.7% | -4.6% | -3.1% | -2.0% |
| UK growth rates lag by one quarter | |||||||
| US Employment | -6.7% | -3.4% | -1.9% | -0.4% | -5.1% | -3.1% | 0.4% |
| US Unemployment | 88.0% | 65.2% | 61.8% | 41.7% | 76.3% | 63.4% | 8.3% |
| US MFG Employment | -17.0% | -9.4% | -4.7% | -4.1% | -13.3% | -8.9% | -2.7% |

Tom Moeller
AuthorMore in Author Profile »Prior to joining Haver Analytics in 2000, Mr. Moeller worked as the Economist at Chancellor Capital Management from 1985 to 1999. There, he developed comprehensive economic forecasts and interpreted economic data for equity and fixed income portfolio managers. Also at Chancellor, Mr. Moeller worked as an equity analyst and was responsible for researching and rating companies in the economically sensitive automobile and housing industries for investment in Chancellor’s equity portfolio. Prior to joining Chancellor, Mr. Moeller was an Economist at Citibank from 1979 to 1984. He also analyzed pricing behavior in the metals industry for the Council on Wage and Price Stability in Washington, D.C. In 1999, Mr. Moeller received the award for most accurate forecast from the Forecasters' Club of New York. From 1990 to 1992 he was President of the New York Association for Business Economists. Mr. Moeller earned an M.B.A. in Finance from Fordham University, where he graduated in 1987. He holds a Bachelor of Arts in Economics from George Washington University.
More Economy in Brief


