 Global| Mar 15 2010
Empire State Business Conditions Show Improved Factory Sector
by:Tom Moeller
|in:Economy in Brief
Summary
The factory sector improved again this month. The Federal Reserve Bank of New York reported that its March Empire State Factory Index of General Business Conditions held onto its sharp improvement from the series' low twelve months [...]
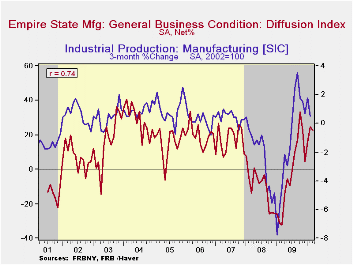
The factory sector improved again this month. The Federal Reserve Bank of New York reported that its March Empire State Factory Index of General Business Conditions held onto its sharp improvement from the series' low twelve months ago. Though down just slightly m/m, the index at 22.86 remained near the highest level since 2004. The latest level suggests positive growth in factory sector activity and it roughly matched Consensus expectations for a reading of 22.0.
The figure is a diffusion index. Since the series' inception in 2001, there has been a 74% correlation between its level and the three-month change in U.S. factory sector production. Like the Philadelphia Fed Index of General Business Conditions, the Empire State Business Conditions Index reflects answers to independent survey questions; it is not a weighted combination of the components. The series dates back only to 2001.
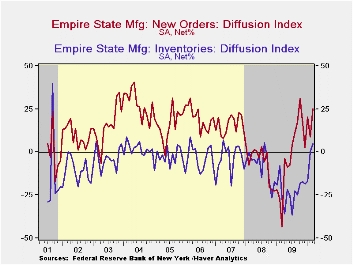
Amongst the separate survey questions, the new orders series led with an increase to nearly the highest level since early-2006. Most other series rose m/m, notably the inventory series which furthered the sharp February gain and landed near its highest in several years. The employment series also rose to 12.35, its highest since 2007. There has been an 87% correlation between the employment index and the three-month growth in factory sector employment as reported by the Labor Department.
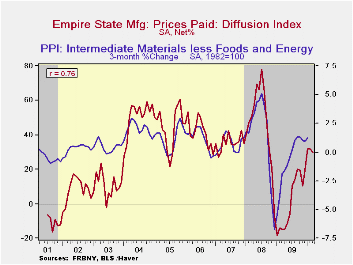
The prices paid index slipped m/m to 29.63 but remained up sharply from the early-2009 low. Since inception there has been a 76% correlation between the index of prices paid and the three-month change in the core intermediate materials PPI.
The Empire State index of expected business conditions in six months inched up m/m and was near the highest since early 2004. The capital expenditure and technology spending series both remained near the highest levels since the recession began.
| Empire State Manufacturing Survey | March | February | January | March '09 | 2009 | 2008 | 2007 |
|---|---|---|---|---|---|---|---|
| General Business Conditions (diffusion index, %) | 22.86 | 24.91 | 15.92 | -32.29 | -2.76 | -9.97 | 17.22 |
| New Orders | 25.43 | 8.78 | 20.48 | -43.35 | -2.52 | -6.22 | 15.70 |
| Inventories | 4.94 | 0.00 | -17.33 | -8.05 | -26.97 | -7.87 | -3.95 |
| Employment | 12.35 | 5.56 | 4.00 | -38,20 | -17.28 | -5.36 | 11.28 |
| Prices Paid | 29.63 | 31.94 | 32.00 | -14.61 | 1.33 | 46.99 | 35.64 |

Tom Moeller
AuthorMore in Author Profile »Prior to joining Haver Analytics in 2000, Mr. Moeller worked as the Economist at Chancellor Capital Management from 1985 to 1999. There, he developed comprehensive economic forecasts and interpreted economic data for equity and fixed income portfolio managers. Also at Chancellor, Mr. Moeller worked as an equity analyst and was responsible for researching and rating companies in the economically sensitive automobile and housing industries for investment in Chancellor’s equity portfolio. Prior to joining Chancellor, Mr. Moeller was an Economist at Citibank from 1979 to 1984. He also analyzed pricing behavior in the metals industry for the Council on Wage and Price Stability in Washington, D.C. In 1999, Mr. Moeller received the award for most accurate forecast from the Forecasters' Club of New York. From 1990 to 1992 he was President of the New York Association for Business Economists. Mr. Moeller earned an M.B.A. in Finance from Fordham University, where he graduated in 1987. He holds a Bachelor of Arts in Economics from George Washington University.
More Economy in Brief


