 Global| Apr 23 2009
E- Area PMIs Are Still Low-Valued But Jump
Summary
The PMI’s for the zone are up sharply in April. At 36.33 the MFG PMI is still in the lower 11 percentile of its range. The services reading at 43.10 is in the lower 16 percentile of its range. These are weak positions that speak of a [...]
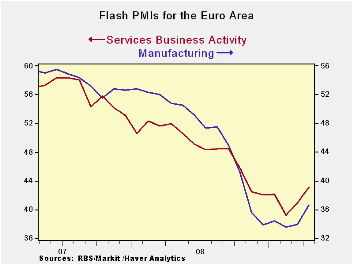
The PMI’s for the zone are up sharply in April. At 36.33 the
MFG PMI is still in the lower 11 percentile of its range. The services
reading at 43.10 is in the lower 16 percentile of its range. These are
weak positions that speak of a continuing low level of economic
activity. But there is also some good news.
In April the MFG PMI has made its largest jump since the
series began in June of 1997. The MFG index is up by 2.73 points in
April. Similarly the Services PMI has risen by 2.15 points and that is
the fourth largest jump m/m rise for services since Feb of 1999 when
that series started.
The jump for services comes on the heels of a 1.17 point gain
in the index in March which was the eight largest rise at that time. So
services in Europe are making greater strides toward improvement in the
last few months.
Of course the level of the two indices is still very low. Both
are below the break-even line of 50; both indices attest to the
continuing unraveling of economic activity in Europe. On top of that a
new poll by the German economic think-tanks projects a 6% drop in GDP
for the year ahead in that key e-Zone country. For the UK, Barclays CEO
has just prognosticated a deep and long downturn in the UK. In France
has a new domestic survey on business sentiment says that it has gained
some small ground.
There are both scattered signs of improvement in Europe and at
the same time pessimistic assessments of where the economy is as well
as of where it is going over the rest of the year. It is not clear
which of these signals markets are going to latch onto. Still, it is
reassuring to see the down drafts slowing. The report of new industrial
orders out the e-Zone today is an example of this topsy-turvy news. EMU
orders took the largest Yr/Yr drop in their history today. Still the
series reported a one of its smallest month-to-month drops. So, even as
the year /year data confirm how bad the orders drop has become, there
is evidence that the declines are set to slow. The bottom line is that
Europe is probably worse off than many have been thinking- including
the authorities that have been reluctant to act aggressively and even
stiffed the US request to do more at the recently concluded G-20
| FLASH Readings | ||
|---|---|---|
| Markit PMIs for the E-Zone | ||
| MFG | Services | |
| Apr-09 | 36.66 | 43.10 |
| Mar-09 | 33.93 | 40.95 |
| Feb-09 | 33.55 | 39.24 |
| Jan-09 | 34.42 | 42.16 |
| Averages | ||
| 3-Mo | 33.97 | 41.10 |
| 6-Mo | 35.41 | 41.66 |
| 12-Mo | 41.90 | 45.06 |
| 127-Mo Range | ||
| High | 60.47 | 62.36 |
| Low | 33.55 | 39.24 |
| % Range | 11.6% | 16.7% |
by Tom Moeller April 23, 2009
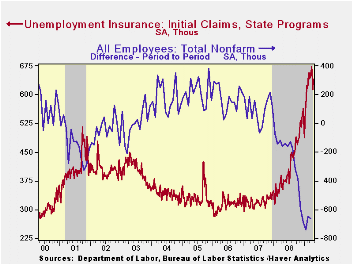
The Bureau of Labor Statistics reported that job market stress
reached another record level and that some leading sign of improvement
is at best tentative. Continuing claims for unemployment insurance
increased to a record high of 6,137,000 are more than double
the year ago level. The series dates back to 1966. The
four-week average of continuing claims also rose to another record of
5,944,000. Continuing claims provide some indication of workers'
ability to find employment and they lag the initial claims figures by
one week.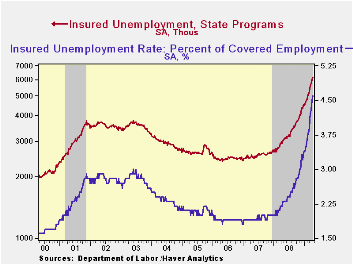
A leading sign of developments in the labor market tends to be provided by initial claims for unemployment insurance. Though claims rose last week to an expected 640,000 from a little revised 613,000 during the prior week, they have fallen during all of this month. The average level of claims during April of 638,000 is down from 658,000 during March. However, the early timing of Easter may have played a role in the decline as the seasonal factors raised the March level. Nevertheless, claims remain near the ten-year high.
The latest claims data cover the survey week for April nonfarm payrolls. Claims held roughly stable at 640,000 with 644,000 last month. During the last ten years there has been an 86% correlation between the level of initial claims and the change in nonfarm payrolls.
The Labor Department indicated that the largest increases in
initial claims for the week ending April 11 were in Florida (+9,303),
Pennsylvania (+7,538), California (+6,404), Wisconsin (+3,611), and New
York (+3,581), while the largest decreases were in Michigan (-12,566),
North Carolina (-6,428), Missouri (-5,575), Kentucky
(-5,313), and Oregon (-4,580).
The insured rate of unemployment continued its upward march. The latest level of 4.6% was double that of last April and the highest level since 1983. During the last ten years there has been a 93% correlation between the level of the insured unemployment rate and the overall rate of unemployment published by the Bureau of Labor Statistics.Clearly the figure understates labor market distress in some states. The highest insured unemployment rates in the week ending April 4 were in Oregon (7.7 percent), Michigan (7.6), Idaho (6.8), Wisconsin (6.7), Puerto Rico (6.6), Pennsylvania (6.3), Nevada (6.1), Rhode Island (6.0), Vermont (5.9), and Montana (5.8).
The unemployment insurance claim data is available in Haver's WEEKLY database.
Introduction to the New Keynesian Phillips Curve from the Federal Reserve Bank of Richmond is available here.
The Phillips Curve and U.S. Macroeconomic Policy: Snapshots, 1958-1996 also from the Federal Reserve Bank of Richmond can be found here.
| Unemployment Insurance (000s) | 04/18/09 | 04/11/09 | 04/04/09 | Y/Y | 2008 | 2007 | 2006 |
|---|---|---|---|---|---|---|---|
| Initial Claims | 640 | 613 | 660 | 81.3% | 420 | 321 | 313 |
| Continuing Claims | -- | 6,137 | 6,044 | 109.5% | 3,342 | 2,552 | 2,459 |
by Tom Moeller April 23, 2009
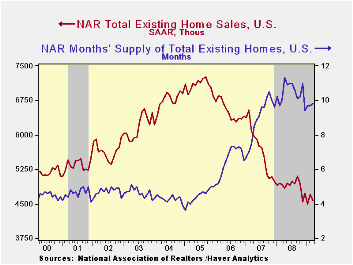
The lower price-higher sales story from the housing market seemed to reverse last month, according to the National Association of Realtors. Sales of existing homes fell 3.0% last month to 4.57M and that reversed most of February' 4.9% gain. Consensus expectations had been for March sales of 4.65M homes. Total sales include sales of condos and co-ops. In each of the country's regions sales during February roughly recovered their January declines.
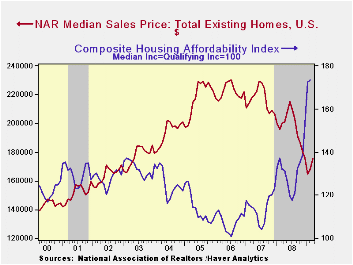
Working the other way were median home prices which rose 4.2% after an upwardly revised 2.1% increase. These gains may reflect, however, the end of the winter doldrums. Prices have fallen 23.5% since their peak. Declines in home prices and lower interest rates have gone a long way to increase the affordability of an existing home which is up roughly one-quarter from one year ago. The measure rose in February to a record high for the series which dates back to 1971.
Sales of existing single-family homes alone also reversed most of the earlier month's gain with a 2.8% m/m decline to 4.100M units. Sales remained near the lowest level since July 1997 and they have been essentially flat for the last four months. (These data have a longer history than the total series).
The number of unsold homes (condos & single-family) on the market reversed a portion of their February increase with a 1.6% decline. Year-to-year inventories are down 9.3%. At the current sales rate there was a 9.8 months' supply on the market which was near the lowest since 2007. For single-family homes the inventory also fell slightly by 1.2% (-9.7% y/y). At the current sales rate there was a 9.3 month's supply, near the lowest since 2007.
The data on existing home sales, prices and affordability can be found in Haver's USECON database. The regional price, affordability and inventory data is available in the REALTOR database.
Global Economy Contracts, With Slow Recovery Next Year from the International Monetary Fund can be found here.
| Existing Home Sales (Thous) | March | February | March y/y % | March '08 | 2008 | 2007 | 2006 |
|---|---|---|---|---|---|---|---|
| Total | 4,570 | 4,710 | -7.1 | 4,920 | 4,893 | 5,674 | 6,516 |
| Northeast | 690 | 750 | -22.5 | 890 | 845 | 1,010 | 1,093 |
| Midwest | 1,040 | 1,040 | -11.1 | 1,170 | 1,130 | 1,331 | 1,494 |
| South | 1,710 | 1,740 | -10.9 | 1,920 | 1,860 | 2,243 | 2,577 |
| West | 1,130 | 1,180 | 18.9 | 950 | 1,064 | 1,095 | 1,357 |
| Single-Family | 4,100 | 4,220 | -5.7 | 4,350 | 4,341 | 4,960 | 5,712 |
| Median Price, Total, $ | 175,200 | 168,200 | -12.4 | 200,100 | 197,250 | 216,633 | 222,042 |

Robert Brusca
AuthorMore in Author Profile »Robert A. Brusca is Chief Economist of Fact and Opinion Economics, a consulting firm he founded in Manhattan. He has been an economist on Wall Street for over 25 years. He has visited central banking and large institutional clients in over 30 countries in his career as an economist. Mr. Brusca was a Divisional Research Chief at the Federal Reserve Bank of NY (Chief of the International Financial markets Division), a Fed Watcher at Irving Trust and Chief Economist at Nikko Securities International. He is widely quoted and appears in various media. Mr. Brusca holds an MA and Ph.D. in economics from Michigan State University and a BA in Economics from the University of Michigan. His research pursues his strong interests in non aligned policy economics as well as international economics. FAO Economics’ research targets investors to assist them in making better investment decisions in stocks, bonds and in a variety of international assets. The company does not manage money and has no conflicts in giving economic advice.
More Economy in Brief


