 Global| Mar 24 2010
Durable Goods Trends ContinueHigher
Summary
Broad trends: Durable goods orders and shipments are still rebounding, but the pace of increase has topped out in February when we observe the Yr/Yr trend in the chart. The rise in orders continues to run ahead of shipments growth. [...]
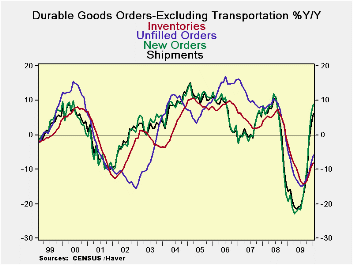
Broad trends: Durable goods orders and shipments are still rebounding, but the pace of increase has topped out in February when we observe the Yr/Yr trend in the chart. The rise in orders continues to run ahead of shipments growth. That bodes well for the prospect for a further advance in shipments. Also the continuing advance of the Fed surveys for March tells us that the MFG rebound is continuing and argues to interpret current weakness as weather-related disruptions to monthly durable goods data as just the sort we’d expect after seeing the knock-down in hours in the February employment report. The monthly data are showing some weakening trends but when grouped into three-month intervals durable goods trends are holding up much better.
Monthly patterns: Monthly data show shipments are off by 0.6% and falling by 0.1% in January. New Orders rose by 0.5% in February compared to a rise of 3.9% in January. Unfilled orders now are up for two months in a row at 0.4% in February and 0.2% in January. Inventories also are up for two months running by 0.3% in February and 0.1% in January. Despite the two-month drop in shipments, many trends even on a monthly basis still show improvement.
Short-term growth rate trends and progressions - The three-month sequential growth rates show shipments are still growing and at a relatively rapid and steady pace in the most recent three months. Orders are accelerating steadily over increasingly more recent three-month periods. Inventories switch to growing from shrinking over the most recent three-month period. Unfilled orders continue to shrink, but the pace of shrinkage is decelerating.
Summing up - Excluding transportation, orders are weaker but shipments are stronger over 3 months and 12 months. For nondefense capital goods, shipments are declining over three months but orders are extremely strong. Ultimately order strength should bring shipments around as shipments are more likely than orders to succumb to short term disturbances like bad weather.
| Durable Goods Orders | |||||
|---|---|---|---|---|---|
| Durable Goods | 3Mo | 6Mo | 9Mo | 12Mo | YearAgo |
| Shipments | 7.0% | 8.8% | 8.2% | 2.1% | -17.3% |
| New Orders | 28.1% | 17.9% | 12.2% | 10.9% | -26.2% |
| Unfilled Orders | -1.1% | -3.6% | -4.5% | -6.5% | -2.3% |
| Inventories | 0.8% | -2.7% | -6.9% | -9.0% | 3.4% |
| I:S Ratio | 1.72 | 1.79 | 1.89 | 1.90 | 1.52 |
| Excluding Transportation | 3Mo | 6Mo | 9Mo | 12Mo | YearAgo |
| Shipments | 9.9% | 9.9% | 9.3% | 3.2% | -16.1% |
| New Orders | 9.2% | 12.9% | 12.3% | 7.9% | -19.9% |
| Unfilled Orders | 3.2% | 2.6% | 0.4% | -3.6% | -7.2% |
| Inventories | 0.5% | -3.1% | -8.2% | -11.0% | -0.1% |
| I:S Ratio | 1.61 | 1.67 | 1.79 | 1.82 | 1.53 |
| Excluding Defense | 3Mo | 6Mo | 9Mo | 12Mo | YearAgo |
| Shipments | 7.1% | 9.3% | 8.5% | 1.8% | -19.3% |
| New Orders | 21.9% | 18.1% | 14.9% | 11.0% | -27.7% |
| Unfilled Orders | -0.2% | -1.9% | -3.1% | -6.4% | -3.9% |
| Inventories | -0.1% | -3.6% | -7.9% | -10.2% | 3.0% |
| I:S Ratio | 1.70 | 1.78 | 1.89 | 1.89 | 1.48 |
| NonDefense Capital Goods | 3Mo | 6Mo | 9Mo | 12Mo | YearAgo |
| Shipments | -0.8% | 6.0% | 3.6% | -0.7% | -12.9% |
| New Orders | 58.5% | 33.9% | 19.1% | 21.4% | -33.4% |
| Unfilled Orders | -1.4% | -4.5% | -5.4% | -8.0% | -0.9% |
| Inventories | 0.0% | -3.6% | -7.7% | -8.7% | 10.8% |
| I:S Ratio | 2.30 | 2.42 | 2.52 | 2.51 | 1.97 |
| Memo: PPI Durables | 0.6% | -0.5% | 0.3% | 0.2% | 3.4% |
by Robert Brusca March 24, 2010
 TheEuro-Area PMIs rose sharply in March. For MFG the index reached a
new
post recession high, it s strongest level since January 2007. For
services, the 1.68 point rise to 53.65 brings it close to its cycle
high reading of 53.71 and it stops a string of two months of
declines.
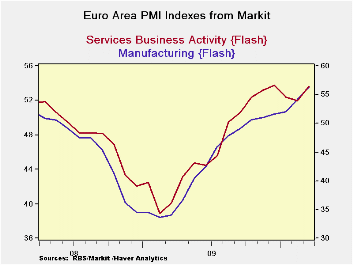
TheEuro-Area PMIs rose sharply in March. For MFG the index reached a
new
post recession high, it s strongest level since January 2007. For
services, the 1.68 point rise to 53.65 brings it close to its cycle
high reading of 53.71 and it stops a string of two months of
declines.
The services index is in the 62nd percentile of its 136 month range; the MFG index is in the 84th percentile of it range.
In addition to all this good news, separately, the German IFO index moved sharply higher, confirming goods news in Germany. The European economy is giving off signals of real strength and brushing off notions that the recovery there was falling on hard times. Still the euro is falling.
The bad news on the day that has dragged down the euro, was the downgrade to Portugal by Fitch. Meanwhile, France and Germany seem to have to come to some agreement about letting the IMF assist Greece in some way. We are all waiting to hear more on this.
With the geopolitics of Europe seemingly dry tinder and sparks flying everywhere, the news of better growth in the Zone is like news of a refreshing spring shower that will damp the risks of spontaneous combustion. There is still a long way to go to get Europe back to where it needs to be. And the problems in Greece and the knock-on effects there have exposed some animosities within the Zone that may have long term effects on it. They could affect not only the Zone’s appetite for expansion but also the perception of the attractiveness of membership in the Zone by potential EMU candidate countries.
| FLASH Readings | ||
|---|---|---|
| Markit PMI's for the Euro-Area | ||
| MFG | Services | |
| Mar-10 | 56.34 | 53.65 |
| Feb-10 | 54.23 | 51.81 |
| Jan-10 | 52.39 | 52.50 |
| Dec-09 | 51.59 | 53.63 |
| Segment Averages | ||
| 3-Mo | 52.74 | 52.65 |
| 6-Mo | 51.57 | 52.86 |
| 12-Mo | 46.50 | 49.60 |
| 136-Mo-Range | ||
| High | 60.47 | 62.36 |
| Low | 33.55 | 39.24 |
| % Range | 84.7% | 62.3% |
| Range | 26.92 | 23.12 |
| Average | 51.13 | 53.64 |
by Robert Brusca March 24, 2010
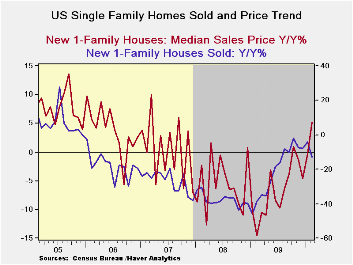
If there is such a thing as a classic signal for a weather effect this is it: sales fall but Yr/Yr prices rise. Housing prices are not seasonally adjusted. They do exhibit some pretty pronounced seasonal patterns, however. Yr/Yr percentage changes purge seasonality from the data but make it harder to detect short term changes.
In February we have a 2.2% month-to-month drop in new home sales led by a 20% drop in the wintry NE and a minus 18% result in the snow-covered Midwest, compared to a -4.6% drop in the South and a 20.8% gain in the West. The winter profile of losses/gains makes sense. The turn up in prices shows median price gains Yr/Yr for the first time since October of last year and only the third Yr/Yr rise for median prices in 27 months. Average prices are up for three-months running; the last three-month rise in prices ended in June of 2007.
Despite some sharp improvement in economic conditions the huge fiscal help offered by the government has reached its limits. Attempts to pull back and inject fiscal prudence are not being well-accepted in France.
On balance this report really has the feel of a report disrupted by weather in a market that is getting back in shape. The existing home sales report was not as clean in producing its weather effects since the lags are longer. Homebuilders count a sale as consummated when the contract is signed. The NAR calls a deal a deal when it closes, meaning that monies are exchanged which means that we must wait out the financing process which these days is running three months in many places.
I find this report on new home sales very encouraging since, once prices are no longer falling, the real impediment to buying is gone. And home affordability is still very high.
| New Single Family Home Sales | |||||||
|---|---|---|---|---|---|---|---|
| As of: Feb.10 |
Momentum: Annualized Rates Of Change | Prices | |||||
| Total | N.E | MidW | South | West | Median | Average | |
| Month-to-month percent change | |||||||
| Feb.10 | -2.2% | -20.0% | -18.0% | -4.6% | 20.8% | 6.1% | 5.1% |
| Jan.10 | -8.7% | -10.3% | 2.0% | -12.6% | -6.1% | -5.2% | -3.8% |
| Dec.09 | -4.7% | 30.0% | -31.0% | -5.4% | 7.9% | 0.2% | 1.8% |
| Annualized Rates | |||||||
| Total | N.E | MidW | South | West | Median | Average | |
| 3-Mo | -59.7% | -26.7% | -169.0% | -84.3% | 89.5% | 3.1% | 12.0% |
| 6-Mo | -49.0% | -44.4% | -53.6% | -59.6% | -27.8% | 13.4% | 20.2% |
| 1-Yr | -13.0% | 0.0% | -18.0% | -29.5% | 34.8% | 5.2% | 9.3% |
| Cumulative prices change since same mo of | SAAR | ||||||
| 2008 | 2007 | 2006 | 2005 | 2004 | 5-yr% | 10-Yr% | |
| Avg | 9.3% | -6.2% | -12.1% | -8.2% | -2.2% | -0.5% | 3.6% |
| Median | 5.2% | -10.1% | -12.1% | -12.1% | -7.1% | -1.5% | 3.1% |
| Yr Yr price changes by 12-mo period | |||||||
| Avg | 9.3% | -15.5% | -5.9% | 3.9% | 6.0% | ||
| Median | 5.2% | -15.3% | -2.0% | 0.0% | 5.0% | Median | Average |
| Feb.10 | Max Drop in Current Prices Since 2000 | -16.0% | -14.2% | ||||
| &Drop is calculated from higest point in period | |||||||

Robert Brusca
AuthorMore in Author Profile »Robert A. Brusca is Chief Economist of Fact and Opinion Economics, a consulting firm he founded in Manhattan. He has been an economist on Wall Street for over 25 years. He has visited central banking and large institutional clients in over 30 countries in his career as an economist. Mr. Brusca was a Divisional Research Chief at the Federal Reserve Bank of NY (Chief of the International Financial markets Division), a Fed Watcher at Irving Trust and Chief Economist at Nikko Securities International. He is widely quoted and appears in various media. Mr. Brusca holds an MA and Ph.D. in economics from Michigan State University and a BA in Economics from the University of Michigan. His research pursues his strong interests in non aligned policy economics as well as international economics. FAO Economics’ research targets investors to assist them in making better investment decisions in stocks, bonds and in a variety of international assets. The company does not manage money and has no conflicts in giving economic advice.
More Economy in Brief


