 Global| Aug 27 2002
Durable Goods Orders Recover
by:Tom Moeller
|in:Economy in Brief
Summary
Durable goods orders recovered much more than expected last month after June's collapse which was revised deeper. July's jump was the largest one month rise since last October and raised orders 7.5% year to date. Orders for nondefense [...]
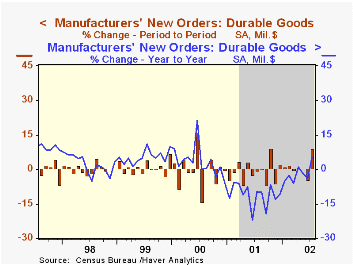
Durable goods orders recovered much more than expected last month after June's collapse which was revised deeper. July's jump was the largest one month rise since last October and raised orders 7.5% year to date.
Orders for nondefense capital goods surged as aircraft orders more than doubled. Excluding aircraft, nondefense capital goods orders also were strong rising 8.1% following a 6.3% decline in June. Nondefense capital goods orders less aircraft were up 5.5% in July versus December.
Orders for computers and electronic products rose 3.9% (-0.1% YTD) following a 4.6% June decline which was deeper than originally reported. Machinery orders jumped 11.8% after a sharp 8.3% June drop. Orders for electrical equipment fell hard for the third consecutive month (0.7% YTD).
Orders for defense goods fell for the third month in four (-13.0% YTD). Durable orders rose 7.3% (5.7% YTD) excluding defense.
Durable shipments rose 3.1% for the first rise in three months.
Durable inventories fell 0.4% (-3.9% YTD), the eighteenth consecutive monthly decline.
| NAICS Classification | July | June | Y/Y | 2001 | 2000 | 1999 |
|---|---|---|---|---|---|---|
| Durable Goods Orders | 8.7% | -4.5% | 5.2% | -11.4% | 3.3% | 5.4% |
| Nondefense Capital Goods | 13.5% | -9.6% | 2.9% | -16.5% | 7.9% | 3.9% |
by Tom Moeller August 27, 2002

The Conference Board’s Index of Consumer Confidence fell more than expected in August. July's level was little revised. Confidence was down 35.4% versus the peak in 2000.
The decline reflected lower readings of the present situation as well as expectations.
The decline in Consumer Confidence was deeper than the decline in the Consumer Sentiment reading from the University of Michigan.
During the last five years there has been a 76% correlation between the level of Consumer Confidence and the y/y percent change in real PCE.
The Conference Board's survey is conducted by a mailed questionnaire to 5,000 households and about 3,500 typically respond.
| Conference Board | August | July | Y/Y | 2001 | 2000 | 1999 |
|---|---|---|---|---|---|---|
| Consumer Confidence | 93.5 | 97.4 | -18.0% | 106.6 | 139.0 | 135.3 |
by Tom Moeller August 27, 2002
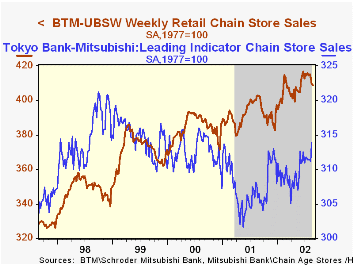
Chain store sales fell for the third consecutive week according to the BTM-UBSW survey.
Sales so far in August are down 0.8% versus the average for July which rose only 0.3% from June.
During the last five years there has been a 61% correlation between the year-to-year percent change in monthly chain store sales and the change in GAF retail sales.
| BTM-UBSW (SA, 1977=100) | 8/24/02 | 8/17/02 | Y/Y | 2001 | 2000 | 1999 |
|---|---|---|---|---|---|---|
| Total Weekly Retail Chain Store Sales | 408.7 | 410.0 | 1.% | 2.1% | 3.4% | 6.7% |

Tom Moeller
AuthorMore in Author Profile »Prior to joining Haver Analytics in 2000, Mr. Moeller worked as the Economist at Chancellor Capital Management from 1985 to 1999. There, he developed comprehensive economic forecasts and interpreted economic data for equity and fixed income portfolio managers. Also at Chancellor, Mr. Moeller worked as an equity analyst and was responsible for researching and rating companies in the economically sensitive automobile and housing industries for investment in Chancellor’s equity portfolio. Prior to joining Chancellor, Mr. Moeller was an Economist at Citibank from 1979 to 1984. He also analyzed pricing behavior in the metals industry for the Council on Wage and Price Stability in Washington, D.C. In 1999, Mr. Moeller received the award for most accurate forecast from the Forecasters' Club of New York. From 1990 to 1992 he was President of the New York Association for Business Economists. Mr. Moeller earned an M.B.A. in Finance from Fordham University, where he graduated in 1987. He holds a Bachelor of Arts in Economics from George Washington University.
More Economy in Brief


