 Global| Oct 25 2002
Durable Goods Orders Down Sharply
by:Tom Moeller
|in:Economy in Brief
Summary
Durable goods orders were quite a bit weaker than expected last month, falling more than in any month since September of last year. The slight August decline was unrevised. Much of the September decline was due to a sharp 46.3% drop [...]

Durable goods orders were quite a bit weaker than expected last month, falling more than in any month since September of last year. The slight August decline was unrevised.
Much of the September decline was due to a sharp 46.3% drop in civilian aircraft orders which had risen 45.7% in August and by 132.1% in July. Orders for motor vehicles and parts fell 2.8%, the sixth monthly decline this year. Orders excluding all transportation equipment fell 1.0% last month and are up 0.7% YTD.
Orders for nondefense capital goods plunged 12.6% owing to the decline in aircraft, but excluding aircraft and parts orders still fell 6.6%.
Orders for computers and electronic products fell 6.0% (-8.6% YTD) following a 2.0% August drop. Machinery orders fell 1.2% for the second consecutive monthly decline. Orders for electrical equipment rose for the second month, up 3.0% (1.4% YTD).
Shipments of durable goods fell 1.1% (1.7% YTD), the fourth decline in five months.
Durable inventories fell 0.2% (-4.3% YTD), the twentieth consecutive monthly decline.
| NAICS Classification | Sept | Aug | Y/Y | 2001 | 2000 | 1999 |
|---|---|---|---|---|---|---|
| Durable Goods Orders | -5.9% | -0.6% | 5.3% | -11.4% | 3.3% | 5.4% |
| Nondefense Capital Goods | -12.6% | 4.7% | 1.2% | -16.5% | 7.9% | 3.9% |
by Tom Moeller October 25, 2002

Sales of new single family homes rose 0.4% last month following a 6.8% August gain that was revised up. Consensus expectations for a 985,000 sales rate.
Sales were mixed across the country’s regions. In the Northeast, sales rose 94.2% to near the record. Sales in the West also were strong. In the Midwest and the South, sales fell
The median price of a new home rose 0.9% to $176,300 (5.9% y/y). Prices in August were revised down slightly.
The new home sales data reflect current sales versus the existing home sales figure which reflect closings on past sales.
| Homes Sales (000s, AR) | Sept | Aug | Y/Y | 2001 | 2000 | 1999 |
|---|---|---|---|---|---|---|
| New Single-Family | 1,021 | 1,017 | 19.3% | 908 | 880 | 879 |
by Tom Moeller October 25, 2002
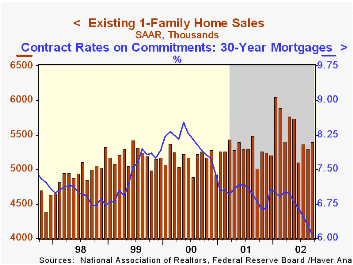
Sales of existing single family homes were slightly stronger than expected in September. Sales rose 1.9% from August which was revised up slightly.
Sales through September were up 3.8% YTD, and during the first nine months were up 4.7% versus 2001.
Home sales were mixed across regions.
The median price of an existing home fell 2.9% to $159,000 (7.9% y/y).
The figures reflect closings of past sales.
The average rate on a conventional 30-year mortgage fell to 6.09% last month versus 6.97% averaged during all of last year.
| Existing Home Sales (000, AR) | Sept | Aug | Y/Y | 2001 | 2000 | 1999 |
|---|---|---|---|---|---|---|
| Existing Single-Family | 5,400 | 5,300 | 7.8% | 5,291 | 5,159 | 5,193 |
by Tom Moeller October 25, 2002

Consumer Sentiment for all of October fell 6.4% from September according to the University of Michigan. The figure was as expected and near the mid-month reading.
Indexes of consumer expectations and current conditions both fell sharply.
The University of Michigan survey is not seasonally adjusted.
| University of Michigan | Oct | Sept | Y/Y | 2001 | 2000 | 1999 |
|---|---|---|---|---|---|---|
| Consumer Sentiment | 80.6 | 86.1 | -2.5% | 89.2 | 107.6 | 105.8 |
by Tom Moeller October 25, 2002

The US budget improved in September, as usual for the end of a fiscal quarter, right on Consensus expectations. The surplus actually was larger than last year's in September of $35.5B.
For Fiscal year 2002, the US budget deficit was $158.5B versus last year's surplus of $127.3B. It was the first fiscal deficit since 1997.
Receipts surged in September 54.7% m/m on the strength of strong individual tax payments but fell 6.9% versus last fiscal year. Individual tax receipts fell 13.7% versus FY 2001. Corporate tax receipts also surged m/m but fell 2.0% versus FY 2001.
Federal expenditures fell m/m, but rose 7.9% in FY 2002. Defense spending was up 14.2% versus FY 2001. Transportation spending also rose a strong 13.5% and spending on education surged 25.0%. Spending on health programs rose 14.2% and income security was up 15.9%. Spending fell 17.0% for interest.
For an analysis of the role of fiscal policy by the San Francisco Fed, click here.
| US Government Finance | Sept | Aug | 2002 | 2001 | 2000 | 1999 |
|---|---|---|---|---|---|---|
| Budget Balance | $41.7B | $-54.7B | $-158.5B | $127.3B | $236.9B | $124.4B |
| Revenues | $192.8B | $124.6B | -6.9% | -1.7% | 10.8% | 6.1% |
| Outlays | $151.1B | $179.3B | 7.9% | 4.2% | 5.0% | 3.1% |

Tom Moeller
AuthorMore in Author Profile »Prior to joining Haver Analytics in 2000, Mr. Moeller worked as the Economist at Chancellor Capital Management from 1985 to 1999. There, he developed comprehensive economic forecasts and interpreted economic data for equity and fixed income portfolio managers. Also at Chancellor, Mr. Moeller worked as an equity analyst and was responsible for researching and rating companies in the economically sensitive automobile and housing industries for investment in Chancellor’s equity portfolio. Prior to joining Chancellor, Mr. Moeller was an Economist at Citibank from 1979 to 1984. He also analyzed pricing behavior in the metals industry for the Council on Wage and Price Stability in Washington, D.C. In 1999, Mr. Moeller received the award for most accurate forecast from the Forecasters' Club of New York. From 1990 to 1992 he was President of the New York Association for Business Economists. Mr. Moeller earned an M.B.A. in Finance from Fordham University, where he graduated in 1987. He holds a Bachelor of Arts in Economics from George Washington University.
More Economy in Brief


