 Global| Sep 27 2007
Despite Q2 Spurt Trend in the U.S. is Slowing
Summary
GDP’s growth in Q3 was revised down marginally in the final estimate to 3.8% from 4% previously. Growth was chipped away in a number of sectors including structures and exports while imports were revised higher. Imports drain growth [...]
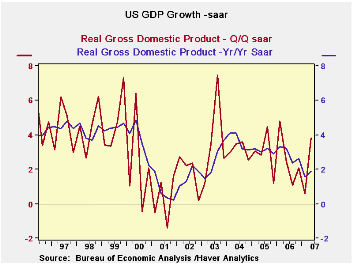
GDP’s growth in Q3 was revised down marginally in the final estimate to 3.8% from 4% previously. Growth was chipped away in a number of sectors including structures and exports while imports were revised higher. Imports drain growth form the economy. GDP’s sojourn above trend in the current quarter was not on fundamental growth. Inventories rose instead of falling. The trade gap was sharply smaller instead of progressively wider. Consumption, the mainstay of GDP, shrank sharply, yet despite that business investment was stronger as GDP’s smaller sectors pushed growth above trend – especially inventories and trade. But consumer spending is two-thirds –or more– of GDP and the economy will not be able to carry strong growth on weak consumer spending. The growth spurt in Q2 was an anomaly - but so was the extreme weakness in Q1.
As the Fed looks at GDP it too is in a quandary. To make forward-looking policy you must be able to see ahead. Right now the trend in productivity is not heartening. Consumer spending has been weak and still looks soft. Vehicle sales show no life and other consumer spending generally has been soft. The August job report showed job creation turn negative. Looking ahead the Fed can’t be sure what happens next. Modest growth is the best guess but risks, mostly to the downside, are in play.
Housing’s slump is now thought to be a longer lived phenomenon than before. But layoff contagion has not hit hard – yet. Jobless claims fell to below the 300K leaving the Sept 22 week with a very strong labor market reading. So even late in Q3 the job market does not seem to have softened judging from jobless claims and despite the drop in employment In August.
On data like this it may be that the Fed is DONE cutting rates. The Fed said its…‘action is intended to help forestall some of the adverse effects on the broader economy that might otherwise arise from the disruptions in financial markets and to promote moderate growth over time.’ The Fed seems to have achieved that goal now. It is not trying to prompt strong growth, just to forestall weak growth. I would judge it to be ‘content’ with the economic results we have seen to date and would expect it to do nothing more...depending on incoming data, of course.
Q1
Q2
Q3
Q4
Q1
by Robert Brusca September 27, 2007
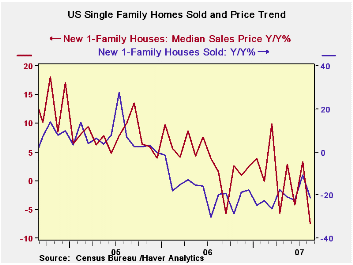
The growth rates in the table below tell an erratic story of trends in the U.S. housing sector. Prices finally are lower year/year but are still, on balance, higher over the past four. Sales of new homes by region have very different histories. The Northeast sees sales lower by just 5% over the past four years ended in August. It is the strongest region by far on that score. The West and Midwest are the weakest with sales off by 43% to 47%. In the South, an area that has a portion of it that has been devastated by hurricanes and flooding is off by 27%. The chart on the left shows that the year over-year declines in home sales are getting progressively smaller. That is, from mid-2006 forward the red line slopes up to the right. That is a sign that while things may be getting worse (since the whole of this portion of the line is below zero) they are not getting worse at a faster rate, but at a slower rate. Still that is not the same as improving.
Monthly data show another sharp drop but that is coming off a rise in July. In August sales rose in two regions, the Northeast and the Midwest, and fell in two others: the South and the West.
At this time it is not clear what would be good news from the sector. Stable sales, of course, would be good news. But how to you get that with the mortgage market in disarray? How do you get that with prices still falling? One odd development that could be construed as good new is sharp drop in new home prices. Yes, a sharp drop. A sharp drop that could get out in front of the trend drop in prices and stabilize them might convince buyers that it is a good time to buy. As long as new home prices are falling the lure to buy is poisoned. That is the problem right now faced by builders.
Of course house builders always have options. They have a certain profit built in to play with – until home prices fall too far. Builders can offer to add features that the potential buyer will view at retail prices but the builder can supply at cost – and so on. But at the moment with the monthly price drop down 8 percent (NSA) home prices are still quite weak and too weak to look for stability to set in. But it is also clear that while the erosion continues, at the same time it is showing some improvement as the year/year declines in sales diminish. Moreover the West is the hardest hit region and that region could get worse if the mortgage market does not get sorted out since so many homes in the West are also expensive and require jumbo mortgage financing – the part of the markets that is in the greatest disarray after subprime per se. The Midwest faces a growing erosion in its industrial base and that is having a knock on impact on housing. The South is getting past its hurricane and flood damage. The Northeast alone is on fairly solid ground already.
| New Single Family Home Sales & Prices | |||||||
|---|---|---|---|---|---|---|---|
| Momentum: Annualized Rates Of Change | Prices | ||||||
| As of: | Total | N.E | Midwest | South | West | Median | Average |
| Aug.07 | Year-to-Year percent change | ||||||
| 1Yr | -21.2% | -14.0% | -11.2% | -27.1% | -16.0% | -7.5% | -0.4% |
| Yr Ago | -19.6% | 7.5% | -22.1% | -11.1% | -39.5% | 1.6% | 7.6% |
| 2Yrs Ago | 6.8% | 23.1% | -11.4% | 14.0% | 3.8% | 10.1% | 8.4% |
| 3Yrs Ago | -2.6% | -16.7% | -14.1% | -1.3% | 8.0% | 14.5% | 3.6% |
| 4Yrs Net | -34.1% | -5.1% | -47.3% | -27.1% | -43.0% | 18.5% | 21.2% |
by Carol Stone September 27, 2007

We've commented on developments in Germany often in recent weeks, but it seems worthwhile as that nation's economy remains firm. Today, the Federal Statistics Office reported on the labor market through August. Employment of German residents rose 19,000 in August and 26,000 in July, continuing a string of increases into a 19th month. Employment within Germany, including commuters from surrounding countries and other foreign nationals, was stronger, adding 15,000 more in each July and August. This broader total employment is up 1.6% from a year ago. By comparison, the UK, Italy and Japan each have roughly 0.5% employment growth over the last year, while France has seen a similar 1.6% to Germany's.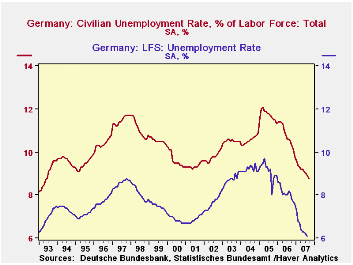
Unemployment continues to decline. The ILO definition, used throughout the Euro area, puts the rate at 6.1% in August, down 2.1 points from the year-ago level and the lowest since November 1992 -- almost 15 years. The Germans own survey of "registered" unemployment gave a rate of 8.8% in September, compared with 10.6% in September 2006. The latest figure is the lowest since the same in June 1993.
The "registered" data are available for the former Western and Eastern regions of Germany. It has long been the case that the Eastern area has had the far weaker economy, but these data highlight that the improvement there is greater than in the West. After a period of relative worsening through the late 1990s, the Eastern unemployment rate has declined more than the Western rate. So from a differential of about 10 percentage points that persisted from 2001 through 2004, the difference is now 7.4%, with the rates for September at 7.3% in the West and 14.7% in the East. Both men and women have benefited, while the rates for both genders together under age 25 have remained in about the same relative positions. That said, the rates in all of Germany for people under 25 have improved noticeably; September's 8.9% is down from 11.0% a year ago and is the lowest September rate since 1993.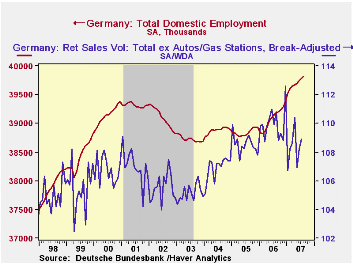 These data don't square well with the weak business confidence measures Louise Curley wrote about Tuesday. The same anomaly we found yesterday in France and Italy seems to apply in Germany too; we pointed out that business is worried in those two countries about orders in manufacturing even as those orders have remained firm. The same collection of uncertainties apply in all these countries: will the financial turmoil that began in the US housing market extend to European goods markets; will unemployment turn back higher after such favorable behavior as recently seen in Germany? A clue might be found in retail trade data: while jobs are increasing, retail trade is not. It stalled in mid-2006 and continues to flutter within a tight range. Thus, as German business leaders and financial analysts describe eroding confidence through their professional surveys, consumers are doing so by holding back on their spending, not a sign of confidence on their part either.
| GERMANY (Seas Adj, ex as noted) | Sep 2007 | Aug 2007 | Jul 2007 | Year Ago | 2006 | 2005 | 2004 |
|---|---|---|---|---|---|---|---|
| LFS Employment (mil) | -- | 39.73 | 39.71 | 39.10 | 39.01 | 38.72 | 38.79 |
| Change (thous) | -- | 19 | 26 | 601 | 281 | -67 | 160 |
| Yr/Yr % Change, NSA | -- | 1.6 | 1.7 | -- | 0.7 | -0.2 | 0.4 |
| Unemployment Rate (%, ILO Def.) |
-- | 6.1 | 6.2 | 8.2 | 8.1 | 9.1 | 9.2 |
| Registered Unemployment Rate (%) | 8.8 | 8.9 | 9.0 | 10.6 | 10.8 | 11.7 | 10.6 |
| Job Vacancies (thous) | 615 | 615 | 611 | 589 | 564.2 | 413.1 | 284.3 |
by Robert Brusca September 27, 2007
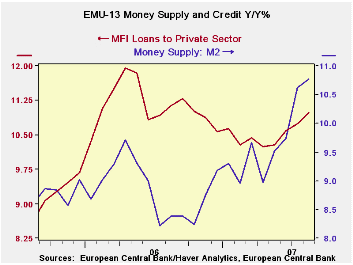
Currency rates are after all the price of one money in terms of another. But currency values are not simply determined by the size or growth in relative money stocks. EMU money supply is now growing faster than the US money supply even though the euro is the strong currency and the dollar is the weaker one.
The ECB is worried about inflation at or close to its ceiling rate. The flash German HICP (released Sept 27th) shows that Germany has seen a turn for the worse in inflation trends in August. The ECB has been wary for some time of money and credit growth above its guidelines. But the ECB paused its tightening effort in the wake of the subprime mortgage crisis. It may soon find it has more work to do.
This notion, however, is complicated by the rise in the euro itself. In Germany unions are already urging the ECB to cut rates to take that upward pressure off the Euro. While it may seem odd for fast money growth to be associated with a rising currency, it is nonetheless true that the rising currency will help to contain whatever inflation pressures may be brewing inside the Euro area.
That is a Euro area dilemma. The euro has risen enough that it going to start to crimp growth. Indeed growth appears to have started to slow even before the Euro crossed the $1.40 threshold.
| Look at Global and Euro Liquidity Trends | ||||||
|---|---|---|---|---|---|---|
| Saar-all | Euro Measures (E13): Money & Credit | G-10 Major Markets: Money | ||||
| €€-Supply M2 | Credit: Resources | Loans | $US M2 | ££UK M4 | ¥¥Jpn M2+Cds | |
| 3-Mo | 12.4% | 12.7% | 12.9% | 5.9% | 13.7% | 1.1% |
| 6-Mo | 11.8% | 13.5% | 12.0% | 6.8% | 14.3% | 1.5% |
| 12-Mo | 10.8% | 11.7% | 11.0% | 6.7% | 13.4% | 1.8% |
| 2Yr | 6.3% | 11.7% | 11.1% | 5.6% | 13.5% | 1.1% |
| 3Yr | 14.2% | 16.7% | 15.8% | 7.8% | 19.0% | 2.0% |

Robert Brusca
AuthorMore in Author Profile »Robert A. Brusca is Chief Economist of Fact and Opinion Economics, a consulting firm he founded in Manhattan. He has been an economist on Wall Street for over 25 years. He has visited central banking and large institutional clients in over 30 countries in his career as an economist. Mr. Brusca was a Divisional Research Chief at the Federal Reserve Bank of NY (Chief of the International Financial markets Division), a Fed Watcher at Irving Trust and Chief Economist at Nikko Securities International. He is widely quoted and appears in various media. Mr. Brusca holds an MA and Ph.D. in economics from Michigan State University and a BA in Economics from the University of Michigan. His research pursues his strong interests in non aligned policy economics as well as international economics. FAO Economics’ research targets investors to assist them in making better investment decisions in stocks, bonds and in a variety of international assets. The company does not manage money and has no conflicts in giving economic advice.
More Economy in Brief


