 Global| May 15 2002
CPI Up Led by Higher Tobacco Prices
by:Tom Moeller
|in:Economy in Brief
Summary
Consumer prices rose about as expected last month. Core inflation rose more than the Consensus expectation for a 0.2% gain. Tobacco prices surged 6.5% (8.8% y/y). Excluding tobacco, the core CPI rose 0.2% for the fifth consecutive [...]
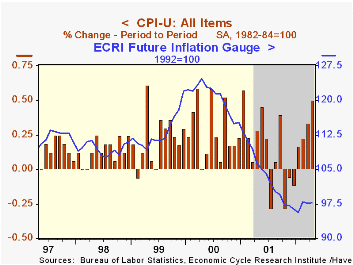
Consumer prices rose about as expected last month. Core inflation rose more than the Consensus expectation for a 0.2% gain.
Tobacco prices surged 6.5% (8.8% y/y). Excluding tobacco, the core CPI rose 0.2% for the fifth consecutive month.
Energy prices were strong for the second consecutive month. Gasoline prices rose 10.1% (-9.0% y/y) and fuel oil prices rose 2.9% (-14.4% y/y). Piped gas and electricity prices were unchanged (-7.6% y/y).
Core inflation was quite tame. Amongst core goods prices only tobacco rose. Home furnishings prices fell 0.1%, the third decline this year. New vehicle prices fell for the fourth consecutive month. Apparel prices fell 0.6% (-2.4% y/y) after a strong March gain.
Services prices less energy rose moderately. Shelter prices rose 0.4% (4.2% y/y). Medical care services were strong, up 0.6% (4.9% y/y). Public transportation prices rose 0.5% (0.7% y/y) after two months down.
| Consumer Price Index | April | Mar | Y/Y | 2001 | 2000 | 1999 |
|---|---|---|---|---|---|---|
| Total | 0.5% | 0.2% | 1.6% | 2.8% | 3.4% | 2.2% |
| Total less Food & Energy | 0.3% | 0.1% | 2.5% | 2.7% | 2.4% | 2.1% |
| Goods less Food & Energy | 0.1% | -0.1% | -1.0% | 0.3% | 0.5% | 0.7% |
| Services less Energy | 0.4% | 0.1% | 4.0% | 3.7% | 3.3% | 2.7% |
| Energy | 4.5% | 3.8% | -8.1% | 3.7% | 16.9% | 3.6% |
| Food & Beverages | 0.1% | 0.2% | 2.5% | 3.1% | 2.3% | 2.1% |
by Tom Moeller May 15, 2002
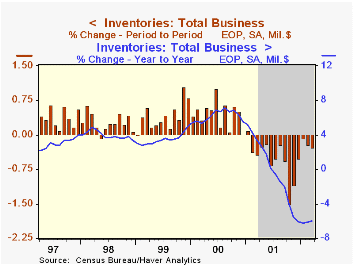
Total business inventories fell in March slightly more than expected. The previously reported decline in February inventories was deepened slightly as part of benchmark revisions that extended back to 1999.
Nonauto retail inventories, the new news in today's report, fell for the second consecutive month and are down 2.1% since the peak in January 2001.
Inventories of furniture & home furnishings rose 0.2% and have been rising since last summer. General merchandise inventories dropped 0.8% (-4.4% y/y). Apparel inventories fell 0.6% (-6.9% y/y).
Overall business sales rose 0.3% (-1.9% y/y), following a February decline.
The inventory-to-sales ratio fell slightly to 1.38 versus 1.42 for all of last year.
| Business Inventories | Mar | Feb | Y/Y | 2001 | 2000 | 1999 |
|---|---|---|---|---|---|---|
| Total | -0.3% | -0.2% | -5.9% | -6.1% | 5.5% | 5.0% |
| Retail | -0.1% | 0.6% | -2.8% | -5.0% | 6.1% | 7.7% |
| Retail excl. Autos | -0.1% | -0.1% | -2.0% | -2.0% | 4.1% | 5.7% |
| Wholesale | -0.0% | -0.9% | -6.1% | -5.5% | 6.6% | 6.0% |
| Manufacturing | -0.6% | -0.5% | -8.6% | -7.5% | 4.3% | 2.2% |
by Tom Moeller May 15, 2002
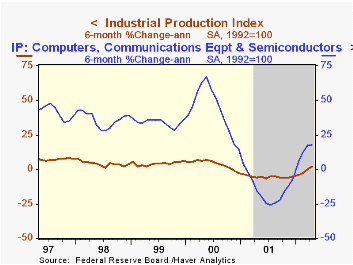
Industrial production rose as expected in April, the fourth consecutive monthly rise. A 0.3% gain in factory sector output, the fourth gain in a row, led the increase. March figures were revised lower.
Excluding high tech production rose 0.3% following a 0.3% March gain.
Output of business equipment rose just 0.1%. Output of high tech equipment rose 1.0%, the seventh consecutive monthly gain.
Capacity utilization rose for the fourth month. Capacity has increased just 1.0% since last year.
| Production & Capacity | April | Mar | Y/Y | 2001 | 2000 | 1999 |
|---|---|---|---|---|---|---|
| Industrial Production | 0.4% | 0.4% | -2.0% | -3.7% | 4.5% | 3.7% |
| Capacity Utilization | 75.5% | 75.3% | 77.8%(4/01) | 76.8% | 81.8% | 81.4% |
by Tom Moeller May 15, 2002
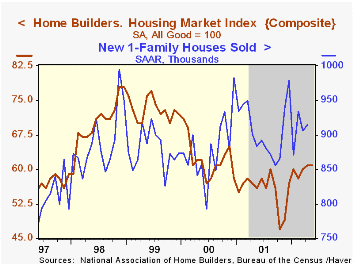
The Nat'l Association of Home Builders index of new home sales remained unchanged last month versus April, but it improved versus yearend 2001.
The index reflects both current conditions for new home buying and expectations of sales in the next six months. Expectations have improved slightly more than the current conditions index.
During the last fifteen years there has been a 70% correlation between the annual percent change in the NAHB Index and the change in new home sales.
| May | April | Y/Y | 2001 | 2000 | 1999 | |
|---|---|---|---|---|---|---|
| Housing Market Index | 61 | 61 | 56 | 56 | 62 | 73 |

Tom Moeller
AuthorMore in Author Profile »Prior to joining Haver Analytics in 2000, Mr. Moeller worked as the Economist at Chancellor Capital Management from 1985 to 1999. There, he developed comprehensive economic forecasts and interpreted economic data for equity and fixed income portfolio managers. Also at Chancellor, Mr. Moeller worked as an equity analyst and was responsible for researching and rating companies in the economically sensitive automobile and housing industries for investment in Chancellor’s equity portfolio. Prior to joining Chancellor, Mr. Moeller was an Economist at Citibank from 1979 to 1984. He also analyzed pricing behavior in the metals industry for the Council on Wage and Price Stability in Washington, D.C. In 1999, Mr. Moeller received the award for most accurate forecast from the Forecasters' Club of New York. From 1990 to 1992 he was President of the New York Association for Business Economists. Mr. Moeller earned an M.B.A. in Finance from Fordham University, where he graduated in 1987. He holds a Bachelor of Arts in Economics from George Washington University.
More Economy in Brief


