 Global| Dec 15 2006
CPI Unchanged
by:Tom Moeller
|in:Economy in Brief
Summary
In November, the consumer price index (CPI-U) remained unchanged following 0.5% declines during the prior two months. Consensus expectations had been for a 0.2% rise. Prices less food & energy also were unchanged after the weak 0.1% [...]
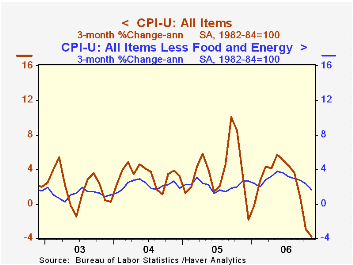
In November, the consumer price index (CPI-U) remained unchanged following 0.5% declines during the prior two months. Consensus expectations had been for a 0.2% rise.
Prices less food & energy also were unchanged after the weak 0.1% October increase. Core prices were last unchanged in June of 2005 and here too Consensus expectations had been for a 0.2% increase.
Core goods prices fell 0.4%. The decline was the fourth in the last five months and was the largest since October 2003. New & used motor vehicle prices dropped 0.8% (-0.9% y/y), off for the third consecutive month, while apparel prices fell 0.3% (+0.2% y/y) for the second consecutive down month.
Household furnishings & operation prices added to the list where prices fell with a 0.2% decline (+0.9% y/y). Also in the act of decline were medical care commodity prices which fell 0.4% (+2.3% y/y) and tobacco prices which fell 0.3% (+1.6% y/y).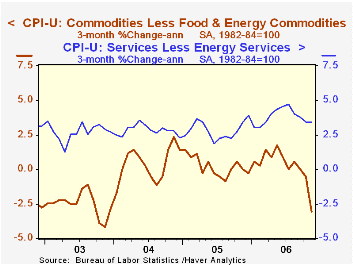
With a 0.2% increase, core services prices posted the weakest gain since this past August. Most of the weakness owed to a 1.9% (-0.2% y/y) decline in public transportation costs, the third consecutive monthly decline. Shelter prices rose 0.4% (4.2% y/y) as the rental equivalence measure of owners' primary residences rose 0.3% (4.3% y/y). Rents rose 0.4% (4.1% y/y) for the sixth consecutive month. Education costs rose a strong 0.5% (6.3% y/y) and medical care services prices increased 0.3% (4.0% y/y).
Energy prices fell 0.2% after two months of roughly 7.0% decline. Gasoline prices fell another 1.6% (-4.2% y/y) but have moved higher in December to an average $2.30 per gallon from $2.23 in November. Fuel oil prices last month rose 0.3% (-3.0% y/y) after two 6.1% m/m declines. Natural gas prices rose 4.7% (-19.9% y/y) but electricity prices fell 0.2% (+6.5% y/y) for the second consecutive month.
Food & beverage prices slipped 0.1%. Dairy product prices fell 0.6% (-1.6% y/y) but prices for meats, poultry, fish & eggs were unchanged (1.2% y/y).
The chained CPI, which adjusts for shifts in the mix of consumer purchases, fell 0.2 as did prices less food & energy prices.
| Consumer Price Index | November | October | Y/Y | 2005 | 2004 | 2003 |
|---|---|---|---|---|---|---|
| Total | 0.0% | -0.5% | 2.0% | 3.4% | 2.7% | 2.3% |
| Total less Food & Energy | 0.0% | 0.1% | 2.6% | 2.2% | 1.8% | 1.5% |
| Goods less Food & Energy | -0.4% | -0.3% | -0.1% | 0.5% | -0.9% | -2.0% |
| Services less Energy | 0.2% | 0.3% | 3.7% | 2.8% | 2.8% | 2.9% |
| Energy | -0.2% | -7.0% | -3.6% | 16.9% | 10.8% | 12.2% |
| Food & Beverages | -0.1% | 0.3% | 2.3% | 2.4% | 3.4% | 2.1% |
| Chained CPI: Total (NSA) | -0.2% | -0.3% | 1.9% | 2.9% | 2.5% | 2.0% |
| Total less Food & Energy | -0.2% | 0.3% | 2.3% | 1.9% | 1.7% | 1.1% |
by Tom Moeller December 15, 2006
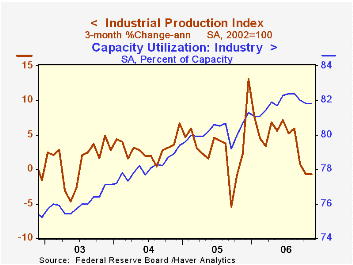
Total U.S. industrial production ticked 0.2% higher last month but revisions generally had the effect of lowering the gains in output. Consensus expectations had been for a 0.1% November rise.
Revisions to the index of industrial production (IP) and the related measures of capacity & capacity utilization reflect the 2004 and 2005 Annual Surveys of Manufactures and selected editions of the 2004 and 2005 Current Industrial Reports.
Factory sector output rose 0.3% but a 0.6% decline during October was double the initial estimate. During the last three months factory sector output is down 0.3% from its August peak.
With a 1.7% (-1.9% y/y) increase, production of durable consumer goods recovered about all of its revised 1.9% October decline as output of automotive products recovered 3.6% (-3.6% y/y). Output of appliances & furniture, however, fell 0.5% (-4.9% y/y) and was off 6.6% from its peak in September 2005. Production of computers, video & audio equipment remained firm and rose 2.3% (13.0% y/y). 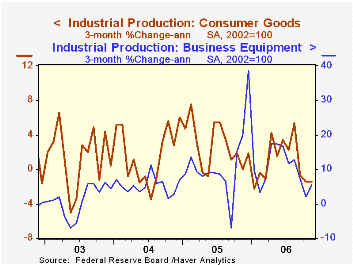
Nondurable consumer goods output slipped 0.1% (2.2% y/y) for the second month in the last three. The gain was softened only by a 1.1% (2.3% y/y) increase in foods & tobacco. Clothing output fell 0.6% (+0.5% y/y), chemical production fell 0.6% (+3.2% y/y) and production of paper products fell 1.4% (+2.2% y/y).
Business equipment production jumped 1.2% but October's increase was lessened to 0.2% from 0.7% reported initially. Output of information processing & equipment rose 1.0% but the 9.9% y/y gain is down from the growth posted earlier this year and those earlier growth rates were revised down. Factory output overall less the hi-tech industries increased 0.1% (2.1% y/y) after two months of sharp decline. Output of transit equipment recovered 2.9% (15.9% y/y) due to a 7.1% (-0.2% y/y) surge in business vehicles.
Overall capacity utilization increased was unchanged from a downwardly revised 81.8% in October. Factory sector utilization, however, increased to 80.2% from a downwardly revised 80.0% in October. Factory sector capacity again rose a firm 0.2% and the 2.7% y/y gain was revised up slightly.The Chinese Economy: Progress and Challenges is today's speech by Federal Reserve Board Chairman Ben S. Bernanke and it is available here.
| Production & Capacity | November | October | Y/Y | 2005 | 2004 | 2003 |
|---|---|---|---|---|---|---|
| Industrial Production | 0.2% | 0.0% | 3.8% | 3.2% | 4.1% | 0.6% |
| Manufacturing (NAICS) | 0.3% | -0.6% | 3.7% | 4.0% | 3.0% | 1.3% |
| Consumer Goods | 0.4% | -0.4% | 1.2% | 2.8% | 1.4% | 1.4% |
| Business Equipment | 1.2% | 0.2% | 9.6% | 7.9% | 4.3% | 0.2% |
| Capacity Utilization | 81.8% | 81.8% | 80.7% (11/05) | 80.2% | 78.1% | 76.1% |
by Tom Moeller December 15, 2006
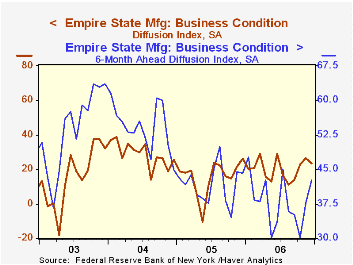
The Empire State Index of General Business Conditions in manufacturing gave back all of its November rise with a 3.53 point decline to 23.13 in December. The decline was, however, less than Consensus expectations for a decline to 18.0. The figures are reported by the Federal Reserve Bank of New York.
Since the series' inception in 2001 there has been a 75% correlation between the index level and the three month change in U.S. factory sector industrial production.
The employment showed the sharpest decline to it lowest level in three months but new orders and shipments rose. The inventory index fell sharply to the lowest in four months, indicating decumulation.
Like the Philadelphia Fed Index of General Business Conditions, the Empire State Business Conditions Index reflects answers to an independent survey question; it is not a weighted combination of the components.
Pricing pressure reversed all of its prior month's improvement and fell to lowest level since August of last year. Since 2001 there has been an 88% correlation between the index of prices paid and the three month change in the core intermediate materials PPI. 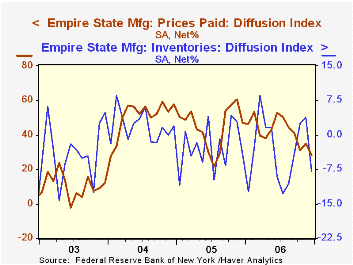
The Empire State index of expected business conditions in six months rose for the second month to the highest level since January.
The Empire State Manufacturing Survey is a monthly survey of manufacturers in New York State conducted by the Federal Reserve Bank of New York. Participants from across the state in a variety of industries respond to a questionnaire and report the change in a variety of indicators from the previous month. Respondents also state the likely direction of these same indicators six months ahead. April 2002 is the first report, although survey data date back to July 2001.
For more on the Empire State Manufacturing Survey, including methodologies and the latest report, click here.
| Empire State Manufacturing Survey | December | November | Dec. '05 | 2006 | 2005 | 2004 |
|---|---|---|---|---|---|---|
| General Business Conditions (diffusion index) | 23.13 | 26.66 | 26.28 | 20.18 | 15.56 | 28.79 |
by Carol Stone December 15, 2006
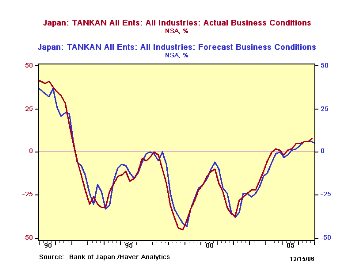
The Bank of Japan's widely watched TANKAN survey showed stronger results across the board in the December report released today in Tokyo.Generally, these surveys are reported just after the beginning of a new quarter, but December is an exception, with the release at mid-month, ahead of the year-end holidays.
Large manufacturers, the "headline" group, saw favorable business conditions at 25% more firms than experienced negative conditions.Three months ago, a balance of 24% expected favorable conditions in December.December's actual result was the best since Q3 2004 at 26%. 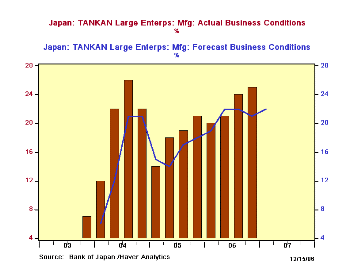
Other firm-size and industry groups also had stronger results than they had forecast three months ago. Large firms in all industries experienced favorable business at a net of 23%, compared to 20% forecast; medium-size firms at 10% versus 7% expected and at small firms, the numbers with favorable and unfavorable business conditions were equal, the first time this has occurred in the present configuration of the TANKAN survey, which began in early 2004.
Expectations for coming March outcomes indicate some moderation. It is frequently the case that these aggregate forecasts point to less breadth of expansion. This might not be surprising because more firms have done better in the current quarter, so the base is higher from which to expect further improvement. Assuming, that is, that "favorable" can be equated with "growing".
We take this opportunity, once again, to highlight Haver's "purist" interpretation of the TANKAN survey. In the 2004 reorganization, the fundamental definition of firm size was changed. It used to be based on the number of employees, but now, as seen in the table below, capital is used. This meant firms shifted from one category to another, particularly capital-intensive firms that have small numbers of employees but much capital; these include the important high-tech sector. So the very character of "large", "medium" and "small" changed from what those categories meant before. With the passage of time, of course, more history becomes available on the behavior of these new size categories. In the meantime, in the database "G10", we include a linked series of All Firms in All Industries (which is not affected by the change in "size" definition); the results here for Q4 2006 stand at +8%, the best reading in exactly 15 years, since Q4 1991.
| Business Conditions: % Favorable minus % Unfavorable |
Dec 2006
Sept 2006
June 2006
Mar 2006 | ||||||
|---|---|---|---|---|---|---|---|
| Forecast for Mar | Actual | Forecast for Dec | Actual | Forecast for Sept | Actual | Forecast for Jun | |
| All Firms | 6 | 8 | 6 | 6 | 6 | 6 | 6 |
| Large Firms* | 20 | 23 | 20 | 22 | 21 | 20 | 20 |
| Manufacturing ("Headline Series") | 22 | 25 | 21 | 24 | 22 | 21 | 22 |
| Nonmanufacturing | 20 | 22 | 21 | 20 | 21 | 20 | 19 |
| Medium-Sized Firms** | 6 | 10 | 7 | 9 | 9 | 8 | 8 |
| Small Firms*** | -4 | 0 | -3 | -3 | -4 | -2 | -2 |

Tom Moeller
AuthorMore in Author Profile »Prior to joining Haver Analytics in 2000, Mr. Moeller worked as the Economist at Chancellor Capital Management from 1985 to 1999. There, he developed comprehensive economic forecasts and interpreted economic data for equity and fixed income portfolio managers. Also at Chancellor, Mr. Moeller worked as an equity analyst and was responsible for researching and rating companies in the economically sensitive automobile and housing industries for investment in Chancellor’s equity portfolio. Prior to joining Chancellor, Mr. Moeller was an Economist at Citibank from 1979 to 1984. He also analyzed pricing behavior in the metals industry for the Council on Wage and Price Stability in Washington, D.C. In 1999, Mr. Moeller received the award for most accurate forecast from the Forecasters' Club of New York. From 1990 to 1992 he was President of the New York Association for Business Economists. Mr. Moeller earned an M.B.A. in Finance from Fordham University, where he graduated in 1987. He holds a Bachelor of Arts in Economics from George Washington University.
More Economy in Brief


