 Global| Mar 18 2010
CPI Stays Unchanged; Core Is Weak
by:Tom Moeller
|in:Economy in Brief
Summary
Consumer price inflation can't develop forward momentum despite moderate improvement in the economy. Or maybe the economy's improving in part because inflation is so low. Either way, the U.S. Bureau of Labor Statistics reported that [...]
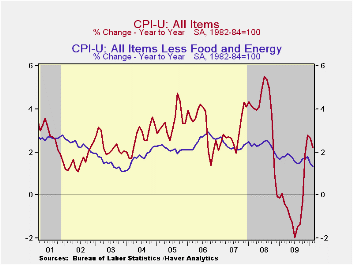
Consumer price inflation can't develop forward momentum despite moderate improvement in the economy. Or maybe the economy's improving in part because inflation is so low. Either way, the U.S. Bureau of Labor Statistics reported that the February CPI was unchanged following five consecutive months of modest 0.2% increase. The latest figure was slightly below Consensus expectations for a 0.1% gain.
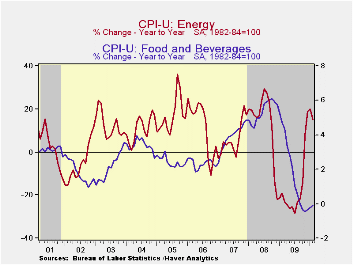
Prices were weak across-the-board. Energy prices slipped 0.5% though the weakness followed several months of strong increase. The latest change reflected a 1.4% m/m decline in gasoline prices but they've risen 36.8% y/y and by 58.0% since the December '08 low. Fuel oil prices slipped 1.3% (+14.5% y/y) but natural gas & electricity prices ticked up 0.5% (-4.2% y/y).
Food & beverage prices continued weak. They were unchanged last month and the y/y decline of 0.1% was near the weakest 12-month change on record. It reflected a 2.8% y/y decline in dairy prices and a 1.4% drop in fruit & vegetable costs. Also down 2.7% y/y were prices for meats, poultry, fish & eggs while cereal & bakery product prices fell 1.1%. Finally, the cost of eating out rose just 1.4%, a record low increase, while alcoholic beverage prices also rose just 1.3% y/y, the least since 1995. Sugar & sweets prices have shown strength with a 2.7% y/y increase.
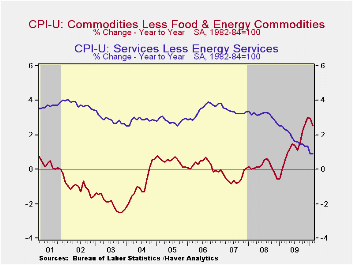
Core consumer prices, goods & service together, rose just 0.1%. Earlier strength in core goods prices continued to wane. Their 0.1% February decline was the first negative reading since early in the recession. The three-month gain eased to 0.7% (AR) from a high of 5.4% last April. New & used motor vehicles prices were one of the only sources of strength and posted another firm 0.4% rise (5.3% y/y). Apparel prices have been unchanged y/y and prices for household furnishings & operation fell 1.7%.
Core services prices nudged up just 0.1% (+0.9% y/y). Weakness in the housing market caused a 0.4% y/y decline in shelter prices while owners equivalent rent of primary residences, a measure not equivalent to other house price measures, slipped again m/m (+0.3% y/y). Elsewhere in services, public transportation prices slipped 0.1% (+4.5% y/y) but medical care services prices gained another 0.4% (3.7% y/y). Finally, education costs remained strong and posted a 0.5% increase (4.7% y/y) but recreation prices slipped for the sixth straight month (-1.0% y/y).
The chained CPI, which adjusts for shifts in consumption patterns slipped slightly last month and rose 2.2% year-to-year. Chained prices less food & energy gained 0.2% and just 1.0% y/y.
| Consumer Price Index (%) | February | January | December | Feb. y/y | 2009 | 2008 | 2007 |
|---|---|---|---|---|---|---|---|
| Total | 0.0 | 0.2 | 0.2 | 2.2 | -0.3 | 3.8 | 2.9 |
| Total less Food & Energy | 0.1 | -0.1 | 0.1 | 1.3 | 1.7 | 2.3 | 2.3 |
| Goods less Food & Energy | -0.1 | 0.1 | 0.1 | 2.5 | 1.3 | 0.1 | -0.4 |
| Services less Energy | 0.1 | -0.2 | 0.1 | 0.9 | 1.9 | 3.1 | 3.4 |
| Energy | -0.5 | 2.8 | 0.8 | 14.9 | -18.1 | 13.7 | 5.6 |
| Food & Beverages | 0.0 | 0.2 | 0.1 | -0.1 | -0.2 | 5.4 | 3.9 |
| Chained CPI: Total (NSA) | -0.0 | 0.4 | 0.8 | 2.2 | -0.4 | 3.3 | 2.5 |
| Total less Food & Energy | 0.2 | -0.0 | 0.1 | 1.0 | 1.3 | 1.9 | 1.9 |
by Tom Moeller March 18, 2010
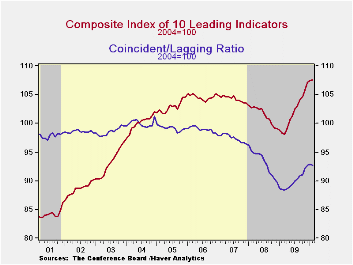
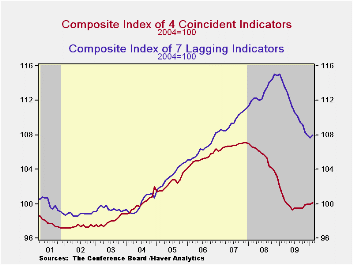
The Conference Board's Index of Leading Economic Indicators rose a modest 0.1% last month following an unrevised 0.3% January increase. While still indicating economic recovery, strength in forward momentum has been lost. The three-month rate of increase at 6.8% was its weakest since April. The leading index is based on actual reports for eight economic data series. The Conference Board initially estimates two series, consumer and capital goods orders.
The breadth of increase amongst the component series slipped last month to its lowest since last March. Four of the ten components rose during February versus nearly all of them during December. During the most recent six months, however, all of the series rose. Prominent in last month's increase was a steeper interest rate yield curve and faster growth in the money supply. A shorter workweek, probably weather related, subtracted 0.3 percentage points from the leaders' increase.
Continuing to suggest just modest economic growth was the coincident indicator series which rose 0.1% after no change during January, revised from 0.2%. The three-month change of 0.8% was diminished from its December peak of 2.0%. Increases in industrial production, real personal income and business sales have been modest but compare to sharp declines late in 2008. Declines in payroll employment also have eased considerably.
The lagging index rose for the first time since January 2009. A shorter duration of unemployment and a faster increase in labor costs turned the change positive. The ratio of coincident-to-lagging indicators (another leading indicator) slipped following ten months of increase.
| Business Cycle Indicators (%) | February | January | December | Oct. 6-Month % (AR) | 2009 | 2008 | 2007 |
|---|---|---|---|---|---|---|---|
| Leading | 0.1 | 0.3 | 1.2 | 9.8 | 0.4 | -2.8 | -0.4 |
| Coincident | 0.1 | 0.0 | 0.1 | 1.2 | -5.1 | -1.2 | 1.4 |
| Lagging | 0.3 | -0.2 | -0.4 | -4.6 | -1.6 | 3.2 | 3.0 |
by Tom MoellerMarch 18, 2010
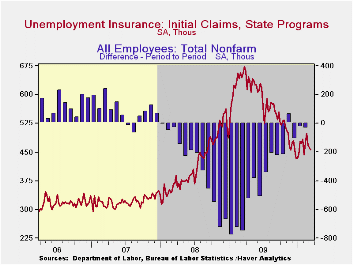
The rate of labor market improvement seems to have slowed. Initial claims for jobless insurance fell another 5,000 last week but it was only to 457,000 from a little revised 462,000 during the prior week. These levels are little changed from December. This flattening compares to earlier sharp declines from the recession peak of 674,000 hit twelve months ago. Claims remained near the lowest level since January 2009. The weekly decline about matched the Consensus expectation. The four-week moving average of initial claims inched up to 471,250.
Continuing claims for unemployment insurance during the latest week remained near the cycle-low and were down by one-third since late-June. The overall decline is a function of the improved job market but also reflects the exhaustion of 26 weeks of unemployment benefits. Continuing claims provide an indication of workers' ability to find employment. The four-week average of continuing claims held roughly steady at the cycle low of 4.579 mil. This series dates back to 1966.
Extended benefits for unemployment insurance dropped sharply to another cycle low of 155,592. They were down by two-thirds from a peak of 597,688 reached in November.Each state administers a separate unemployment insurance program within guidelines established by Federal law. Benefit amounts and the length of time benefits are received and determined by state law. For example, in Michigan and New York an additional 73 weeks of benefits are available and in California an additional 79 weeks are available.
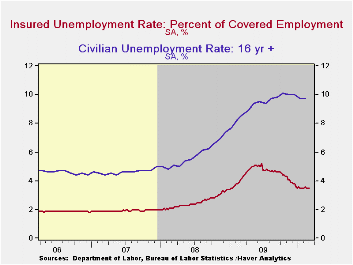
The insured rate of unemployment held steady at 3.5% during the prior week. The rate reached a high of 5.2% during late-June. During the last ten years, there has been a 93% correlation between the level of the insured unemployment rate and the overall rate of unemployment published by the Bureau of Labor Statistics.
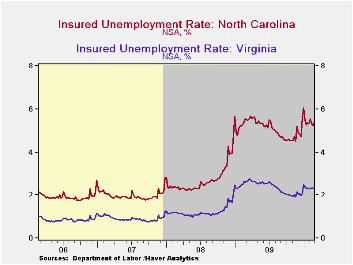
The highest insured unemployment rates in the week ending February 21 were in Alaska (7.2% percent), Oregon (6.3), Pennsylvania (6.3), Wisconsin (6.1), Michigan (5.6), Nevada (5.6) and North Carolina (5.4). The lowest insured unemployment rates were in Virginia (2.3), Texas (2.4), Florida (3.3), Georgia (3.3), Mississippi (3.6), Wyoming (3.7), Maryland (3.7), Ohio (3.8), Indiana (3.9), New York (4.3) and Maine (4.6). These data are not seasonally adjusted but the overall insured unemployment rate is.
The unemployment insurance claims data is available in Haver's WEEKLY database and the state data is in the REGIONW database.
| Unemployment Insurance (000s) | 3/12/10 | 3/6/10 | 2/27/10 | Y/Y | 2009 | 2008 | 2007 |
|---|---|---|---|---|---|---|---|
| Initial Claims | 457 | 462 | 468 | -29.0% | 573 | 419 | 321 |
| Continuing Claims | -- | 4,579 | 4,567 | -15.8% | 5,835 | 3,345 | 2,552 |
| Insured Unemployment Rate (%) | -- | 3.5 | 3.5 | 4.3 (3/2009) | 4.4 | 2.5 | 1.9 |
by Carol Stone March 18, 2010
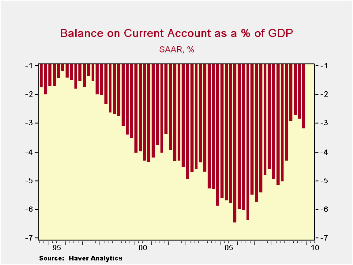
The U.S. current account deficit widened for a second quarter
in Q4 to $115.6 billion from $102.3 in Q3. The result was a bit
narrower, though than consensus expectations, which called for $118.5
billion. As a percentage of GDP, the deficit was 3.2%, compared with
2.9% in Q3. For 2009 as a whole, the deficit totaled $419.9 billion,
much smaller than the $706.1 billion in 2008, and the smallest annual
figure since 2001. The year's ratio to GDP was 2.9% and that was the
smallest since 2.4% in 1998.
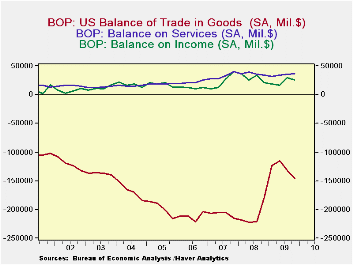
The balance on goods was $145.5 billion in Q4, larger than the
$132.1 billion in Q3. Both exports and imports had a second consecutive
quarter of increases, with imports, at 9.3%, somewhat more than export,
8.8% [large as these are, they are quarter-to-quarter changes, not
annual rates]. This contrasts with the aggregates for all of 2009,
which showed a bigger drop in imports, 26.2%, than in exports, at
18.1%. The balance on services hovered in a narrow range, coming at
$36.5 billion for Q4, compared with $35.7 billion in Q3 and an average
of $35.3 billion over the last eight quarters. Exports of services
gained for a third successive quarter and imports for a second. Among
exports, freight transportation and "other" private services seem to be
leading a recovery. There is little distinctive or sustained change
among import categories; foreign travel turned up in Q3, but then edged
back, and freight transportation increased modestly in both Q3 and Q4.
The balance on income turned down a bit in Q4, but at $25.1 billion and
$29.1 billion in Q3, it is well ahead of the first half of 2009, which
showed $16.6 billion in Q2 and $18.2 billion in Q1. Direct investment
income, both receipts and payments, contributed to an upturn in income
flows as economies in the US and abroad come out of recession.
Unilateral transfers sagged somewhat in Q4, coming in at $31.8 billion,
down from $35.0 and $33.3 billion in Q3 and Q2, respectively. For the
year, however, they totaled $130.2 billion, up from $128.4 billion in
2008 and a record for a single year. Government grants and pension
payments were larger in the year; private remittances were a bit
smaller than in 2008, but were still the second largest annual amount
ever.
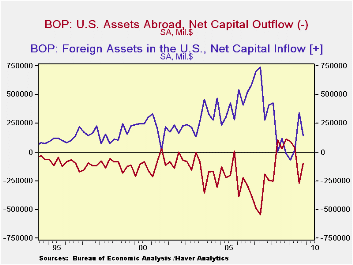
Financial flows showed somewhat irregular movements. In Q3 and Q4, there were net outflows of US funds as ownership of assets abroad increased. In Q3 this was a substantial $269.2 billion, and in Q4, "just" $99.1 billion. The Q3 amount included securities purchases, bank lending and the receipt of $47.7 billion in an allocation of special drawing rights (SDRs) from the IMF, a world-wide move intended to bolster world trade. For all of 2009, US private assets abroad increased by a total of $727.0 billion, a sharp turn-around from the liquidation of assets abroad of $534.4 billion in 2008. All US assets abroad increased by $237.5 billion for 2009, a very different result from the basically flat pattern in 2008.
Foreigners resumed significant purchases of assets in the US during the second half of 2009, amounting to $343.4 billion in Q3 and $144.8 billion in Q4. Foreign official investors were sizable buyers of US Treasury securities throughout the year, and private investors picked up their direct investment in the second half; while this latter came at a slower pace than 2006 through 2008, it did mark an upturn from quite sluggish amounts in the first half of 2009. These financial flows thus indicate some hesitant recovery following the recent dramatic contractions in world financial markets and the world economy, evident in the last graph by the retreat of both lines toward zero.
| US Balance of Payments SA | 4Q '09 | 3Q '09 | 2Q '09 | Year Ago | 2009 | 2008 | 2007 |
|---|---|---|---|---|---|---|---|
| Current Account Balance ($ Bil.) | -115.6 | -102.3 | -97.7 | -154.9 | -419.9 | -706.1 | -726.6 |
| Deficit % of GDP | 3.2 | 2.9 | 2.8 | 4.3 | 2.9 | 4.9 | 5.2 |
| Balance on Goods ($ Bil.) | -145.5 | -132.1 | -115.5 | -178.8 | -517.0 | -840.3 | -831.0 |
| Exports | 8.8% | 7.2% | -1.3% | -1.3% | -18.1% | 12.2% | 12.1% |
| Imports | 9.3% | 9.5% | -3.2% | -7.9% | -26.2% | 7.5% | 5.7% |
| Balance on Services ($ Bil.) | 36.5 | 35.7 | 34.4 | 34.3 | 138.4 | 144.3 | 129.6 |
| Exports | 2.0% | 3.0% | 2.0% | -1.4% | -7.4% | 8.9% | 15.8% |
| Imports | 1.9% | 2.7% | -0.2% | -4.1% | -8.5% | 8.0% | 7.5% |
| Balance on Income ($ Bil.) | 25.1 | 29.1 | 16.6 | 21.1 | 89.0 | 118.2 | 90.8 |
| Unilateral Transfers ($ Bil.) | -31.8 | -35.0 | -33.3 | -31.5 | -130.2 | -128.4 | -116.0 |

Tom Moeller
AuthorMore in Author Profile »Prior to joining Haver Analytics in 2000, Mr. Moeller worked as the Economist at Chancellor Capital Management from 1985 to 1999. There, he developed comprehensive economic forecasts and interpreted economic data for equity and fixed income portfolio managers. Also at Chancellor, Mr. Moeller worked as an equity analyst and was responsible for researching and rating companies in the economically sensitive automobile and housing industries for investment in Chancellor’s equity portfolio. Prior to joining Chancellor, Mr. Moeller was an Economist at Citibank from 1979 to 1984. He also analyzed pricing behavior in the metals industry for the Council on Wage and Price Stability in Washington, D.C. In 1999, Mr. Moeller received the award for most accurate forecast from the Forecasters' Club of New York. From 1990 to 1992 he was President of the New York Association for Business Economists. Mr. Moeller earned an M.B.A. in Finance from Fordham University, where he graduated in 1987. He holds a Bachelor of Arts in Economics from George Washington University.
More Economy in Brief


