 Global| Jan 18 2006
CPI Fell Again, Unexpectedly; 2005 Strongest Since 2000
by:Tom Moeller
|in:Economy in Brief
Summary
The consumer price index (CPI-U) fell 0.1% last month on the heels of the 0.6% drop during November. Consensus expectations had been for a 0.2% rise. Despite the latest declines, the 2005 average rise in prices of 3.4% was the [...]
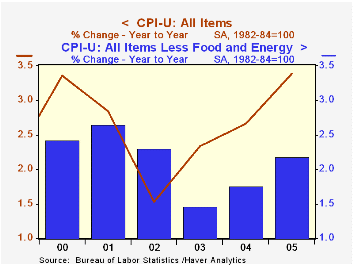
The consumer price index (CPI-U) fell 0.1% last month on the heels of the 0.6% drop during November. Consensus expectations had been for a 0.2% rise. Despite the latest declines, the 2005 average rise in prices of 3.4% was the strongest since 2000 while the December to December rise of 3.4% equaled the 2004 increase.
Energy prices posted a surprising 2.2% decline last month due to widespread m/m declines in fuel oil (+24.0% y/y) and natural gas (+30.1% y/y) prices. Gasoline prices also fell for the third straight month (+16.1% y/y) to an average $2.19 but have wince risen to an average $2.30 in January.
Food prices likewise were under control and rose just 0.2%, the slimmest increase since August.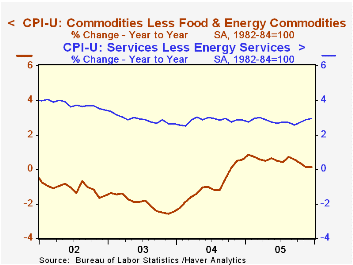
Prices less food & energy again rose 0.2%, the third consecutive such increase and matched Consensus expectations. The year to year gain in core prices core prices accelerated during the last two years from the low of 1.5% during 2003 as core goods prices inflated rather than fell. In December, goods prices less food & energy were unchanged and the 2005 increase of 0.5% was the strongest since 2000.
A 0.3% decline in apparel prices (-1.1% y/y) was accompanied by lower prices for new & used vehicles (+0.4% y/y). These declines were offset by higher furniture & bedding prices (0.6% y/y) and higher appliance prices (3.0% y/y). Medical care commodity prices rose 0.2% (3.7% y/y) while educational books & supplies also rose 0.4% (5.1% y/y).
Core services prices increased 0.3% but the full year gain of 2.8% just equaled 2004. The increase in medical care prices faded late in the year (4.4% y/y) and but school tuition & fees posted a strong 6.2% December to December spike. The increase in shelter prices was steady at (2.5% y/y).
The chained CPI which adjusts for shifts in the mix of consumer purchases fell for the second consecutive month though the full year gain of 2.8% was the strongest since the series inception. Less food & energy prices also fell m/m but the annual increase of 1.8% was the strongest since 2002.
Productivity and Economic Outlook, today's speech by Fed Governor Susan Schmidt Bies can be found here.
| Consumer Price Index | Dec | Nov | Y/Y | 2005 | 2004 | 2003 |
|---|---|---|---|---|---|---|
| Total | -0.1% | -0.6% | 3.4% | 3.4% | 2.7% | 2.3% |
| Total less Food & Energy | 0.2% | 0.2% | 2.2% | 2.2% | 1.8% | 1.5% |
| Goods less Food & Energy | 0.0% | -0.1% | 0.1% | 0.5% | -0.9% | -2.0% |
| Services less Energy | 0.3% | 0.4% | 3.0% | 2.8% | 2.8% | 2.9% |
| Energy | -2.2% | -8.0% | 17.0% | 16.9% | 10.9% | 12.2% |
| Food | 0.2% | 0.3% | 2.4% | 2.5% | 3.4% | 2.1% |
| Chained CPI: Total (NSA) | -0.3% | -0.5% | 2.8% | 2.8% | 2.3% | 2.0% |
| Total less Food & Energy | -0.2% | 0.0% | 1.7% | 1.8% | 1.5% | 1.1% |
by Tom Moeller January 18, 2006
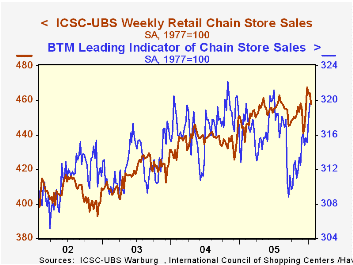
Chain store sales fell 1.4% last week following the modest 0.1% rise which opened the new year according to the International Council of Shopping Centers (ICSC)-UBS survey.
Solid increases throughout December pulled the yearend level up. Therefore, despite recent weakness, sales in January are 1.5% ahead of December.
During the last ten years there has been a 51% correlation between the y/y change in chain store sales and the change in non-auto retail sales less gasoline, as published by the US Census Department. Chain store sales correspond directly with roughly 14% of non-auto retail sales less gasoline.
The leading indicator of chain store sales rose strongly for the second consecutive week. The 0.6% gain pulled January 1.2% ahead of December which rose 0.8% from November.The ICSC-UBS retail chain-store sales index is constructed using the same-store sales (stores open for one year) reported by 78 stores of seven retailers: Dayton Hudson, Federated, Kmart, May, J.C. Penney, Sears and Wal-Mart.
| ICSC-UBS (SA, 1977=100) | 01/14/06 | 01/07/06 | Y/Y | 2005 | 2004 | 2003 |
|---|---|---|---|---|---|---|
| Total Weekly Chain Store Sales | 457.7 | 464.3 | 3.1% | 3.6% | 4.7% | 2.9% |
by Tom Moeller January 18, 2006
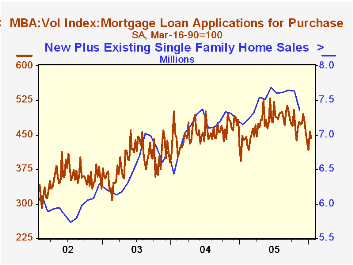
The total number of mortgage applications rose 2.2% last week, the second up week following four consecutive weeks down. This year, mortgage applications are 2.1% higher than during December.
Higher applications to refinance accounted for all of last week's rise. A 9.9% w/w gain followed a like increase which opened the new year and lifted the level of refis 11.0% this month above December.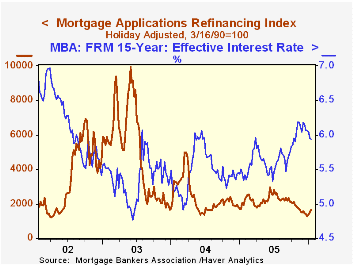
The effective interest rate on a conventional 30-year mortgage fell for the eighth week in the last nine to 6.31% versus an average 6.48% in December. The effective rate on a 15-year mortgage also fell to 5.94%, the second week below 6% since October. The interest rates on 15 and 30 year mortgages are closely correlated (>90%) with the rate on 10 year Treasury securities.
Purchase applications fell 3.0% following a 9.3% surge the prior week. The decline pulled purchase applications in January 1.1% below the December average.
During the last ten years there has been a 50% correlation between the y/y change in purchase applications and the change in new plus existing single family home sales
The Mortgage Bankers Association surveys between 20 to 35 of the top lenders in the U.S. housing industry to derive its refinance, purchase and market indexes. The weekly survey accounts for more than 40% of all applications processed each week by mortgage lenders. Visit the Mortgage Bankers Association site here.
Are Banks Vulnerable to a Housing Bust from the Federal Reserve Bank of St. Louis is available here.
| MBA Mortgage Applications (3/16/90=100) | 01/13/06 | 01/06/06 | Y/Y | 2005 | 2004 | 2003 |
|---|---|---|---|---|---|---|
| Total Market Index | 613.3 | 600.1 | -10.2% | 708.6 | 735.1 | 1,067.9 |
| Purchase | 443.9 | 457.4 | -0.9% | 470.9 | 454.5 | 395.1 |
| Refinancing | 1,645.2 | 1,497.5 | -19.7% | 2,092.3 | 2,366.8 | 4,981.8 |
by Carol Stone January 18, 2006
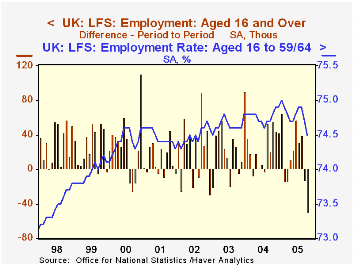
Employment has begun to falter in the UK, according to the latest Labor Force Survey, published today by the Office of National Statistics (ONS). In the 3 months centered on October, the number of people employed fell 49,000 from September's 3-month average and stood only 0.8% above a year ago. As recently as August the year-on-year gain was 1.3%. The employment rate decreased 0.2 percentage points in the October reading to 74.5% from 74.7% in September and 74.8 in the October period of 2004. This rate, the number employed compared to the population of "working age" (16-59 for women and 16-64 for men), peaked at 75.0% last January. Commensurately, the unemployment rate has risen, reaching 5.0% most recently, up from a low of 4.7% recorded in August.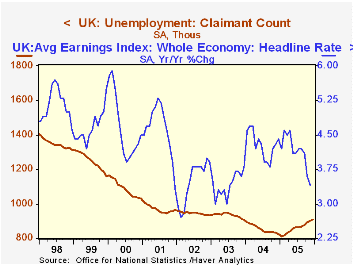
Associated wage and unemployment insurance data also show softening. The average earnings index, watched by many in the UK as a harbinger of inflation pressures, had just a 3.4% yearly growth rate in the three months ended November, slowing from 4.6% as recently as April. The number of claimants for Jobseeker's Allowance benefits rose in the month of December to 909,100 from 901,900 in November and 825,000 in December 2004.
There are other scattered signs of softening in the UK. Consumer confidence turned negative in October, and industrial production declined irregularly through much of 2005. The CBI industrial trends survey shows marked declines in order books continuously since March. GDP growth slowed to below 2% year-on-year in Q2 and Q3. [Q4 data are due to be reported next Wednesday, January 25.] Exports, by contrast, have been rising as have retail sales. So there is some mixed quality to UK economic activity, but the basic industry appears sluggish and it's hardly surprising that the labor market is sharing in this.
| UK Labor Force Survey (SA) | Dec 2005 | Nov 2005 | Oct 2005 | Sept 2005 | Year Ago | 2004 | 2003 | 2002 |
|---|---|---|---|---|---|---|---|---|
| Employment (Thous) | -- | -- | 28,764 | 28,813 | 28,542 | 28,465 | 28,183 | 27,917 |
| Change (Thous/%) | -- | -- | -49 | -12 | 0.8 | 1.0 | 1.0 | 0.8 |
| Employment Rate (%) | -- | -- | 74.5 | 74.7 | 74.8 | 74.8 | 74.6 | 74.5 |
| Unemployment Rate (%) | -- | -- | 5.0 | 4.9 | 4.7 | 4.8 | 5.0 | 5.2 |
| Average Earnings Index (Yr/Yr %) | -- | 3.4 | 3.6 | 4.1 | 4.3 | 4.3 | 3.4 | 3.5 |
| Claimant Count (Thous) | 909.1 | 901.9 | 891.5 | 878.0 | 825.0 | 853.6 | 933.3 | 946.7 |

Tom Moeller
AuthorMore in Author Profile »Prior to joining Haver Analytics in 2000, Mr. Moeller worked as the Economist at Chancellor Capital Management from 1985 to 1999. There, he developed comprehensive economic forecasts and interpreted economic data for equity and fixed income portfolio managers. Also at Chancellor, Mr. Moeller worked as an equity analyst and was responsible for researching and rating companies in the economically sensitive automobile and housing industries for investment in Chancellor’s equity portfolio. Prior to joining Chancellor, Mr. Moeller was an Economist at Citibank from 1979 to 1984. He also analyzed pricing behavior in the metals industry for the Council on Wage and Price Stability in Washington, D.C. In 1999, Mr. Moeller received the award for most accurate forecast from the Forecasters' Club of New York. From 1990 to 1992 he was President of the New York Association for Business Economists. Mr. Moeller earned an M.B.A. in Finance from Fordham University, where he graduated in 1987. He holds a Bachelor of Arts in Economics from George Washington University.
More Economy in Brief


