 Global| Dec 15 2005
CPI Decline Largest Since 1949; Core Inflation Steady
by:Tom Moeller
|in:Economy in Brief
Summary
The consumer price index (CPI-U) fell 0.6% last month, posting the largest m/m decline since a 0.8% drop in July of 1949. Sharply lower gasoline prices and tame "core" goods prices caused the figure to exceed Consensus expectations [...]
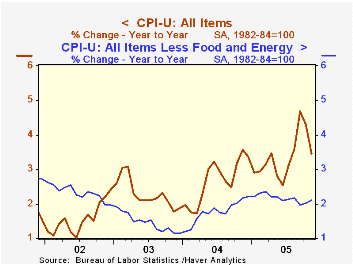
The consumer price index (CPI-U) fell 0.6% last month, posting the largest m/m decline since a 0.8% drop in July of 1949. Sharply lower gasoline prices and tame "core" goods prices caused the figure to exceed Consensus expectations for a 0.4% fall.
Prices less food & energy rose 0.2% in November and matched Consensus expectations. Core goods prices fell 0.1%, mostly due to a large 1.6% (NSA, -15.5% y/y) decline in computer & peripheral equipment prices. New & used vehicle prices also fell by 0.3% but it was due mostly to a 0.9% drop in used vehicle prices.
Pricing of many other goods was fairly firm. A 0.7% gain in furniture & bedding offset a 0.6% decline in appliance prices. Medical care commodity prices rose 0.6% (3.3% y/y) while educational books & supplies also rose 0.6% (5.4% y/y). Apparel prices rose 0.2% (-1.2% y/y) and tobacco prices rose 0.4% (6.1% y/y).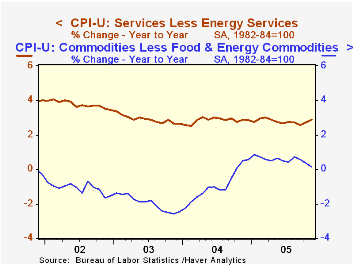
Core services prices increased 0.4% reflecting price gains of 0.6% (4.8% y/y) for medical care and 0.6% (6.2% y/y) for school tuition & fees. Shelter prices rose 0.3% (2.5% y/y) but public transportation prices were unchanged (5.9% y/y).
Energy prices fell 8.0% due to a 16.0% decline in gasoline prices to an average $2.26 per gallon (+16.1% y/y). Gasoline prices have fallen further in December to an average $2.17 while fuel oil prices also fell last month by 4.3% (+24.1% y/y. The bugger was a 2.1% rise in piped gas & electricity prices (19.8% y/y). A surprising 0.5% m/m decline (36.2% y/y) in natural gas prices will not likely be repeated given the rise in gas prices to record heights this month. Electricity prices rose 3.8% (11.3% y/y) in November.
The chained CPI which adjusts for shifts in the mix of consumer purchases fell 0.5% and less food & energy chain prices rose 0.3%.
Trend Inflation, Firm-Specific Capital, and Sticky Prices from the Federal Reserve Bank of Richmond can be found here.
| Consumer Price Index | Nov | Oct | Y/Y | 2004 | 2003 | 2002 |
|---|---|---|---|---|---|---|
| Total | -0.6% | 0.2% | 3.5% | 2.7% | 2.3% | 1.6% |
| Total less Food & Energy | 0.2% | 0.2% | 2.1% | 1.8% | 1.5% | 2.3% |
| Goods less Food & Energy | -0.1% | 0.0% | 0.1% | -0.9% | -2.0% | -1.1% |
| Services less Energy | 0.4% | 0.3% | 2.9% | 2.8% | 2.9% | 3.8% |
| Energy | -8.0% | -0.2% | 18.1% | 10.9% | 12.2% | -5.9% |
| Food | 0.3% | 0.3% | 2.2% | 3.4% | 2.1% | 1.8% |
| Chained CPI: Total (NSA) | -0.5% | 0.3% | 2.8% | 2.3% | 2.0% | 1.3% |
| Total less Food & Energy | 0.0% | 0.4% | 1.7% | 1.5% | 1.1% | 1.9% |
by Tom Moeller December 15, 2005
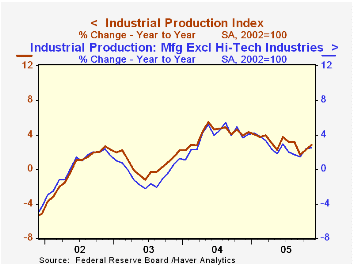
A surprising 4.8% jump in mining output pushed the gain in overall industrial output last month to 0.7% and that exceeded Consensus expectations for a 0.5% rise.
Factory sector production rose a moderate 0.4% (4.1% y/y) on the heels of the 1.9% spike in October which followed curtailments due to hurricanes.
Higher output of business equipment again led the strength in factory output. A 0.9% (10.4% y/y) increase last month reflected strong gains in transit equipment (12.8% y/y), information processing equipment (19.4% y/y) and industrial & other (5.0% y/y). Excluding the high tech sector altogether, factory output gained 0.1% (2.5% y/y).
Consumer goods output fell by 0.8% (+1.4% y/y) led by a 5.2% decline (+0.2% y/y) fall in automotive products. Output of appliances, furniture & carpeting also fell hard by 1.6% (+2.0% y/y) but output of computers, video & audio equipment output rose 4.2% (2.4% y/y). Nondurables output inched up 0.1% with apparel output up 0.8% (-2.6% y/y).
Total capacity utilization rose to 80.2% and capacity grew 1.6% y/y. Factory sector utilization rose to 79.4% while capacity rose 2.1% y/y.
| Production & Capacity | Nov | Oct | Y/Y | 2004 | 2003 | 2002 |
|---|---|---|---|---|---|---|
| Industrial Production | 0.7% | 1.2% | 2.8% | 4.1% | 0.6% | 0.1% |
| Consumer Goods | -0.8% | -0.2% | 1.4% | 2.1% | 1.0% | 2.2% |
| Business Equipment | 0.9% | 7.4% | 10.4% | 9.3% | 0.0% | -7.8% |
| Capacity Utilization | 80.2% | 79.8% | 79.3% (11/04) | 78.6% | 75.7% | 75.2% |
by Tom Moeller December 15, 2005

The Empire State Index of General Business Conditions in New York's manufacturing industries rose further in December. The 5.92 point gain to 28.74 followed a 10.7 point increase last month. Consensus expectations had been for a decline to 18.5.
Since the series' inception in 2001 there has been a close 80% correlation between the index level and the three month change in factory sector production.
The new orders index surged 4.3 points to the highest level since August though shipments fell as did the employment index to its lowest level since July.
Like the Philadelphia Fed Index of General Business Conditions, the Empire State Business Conditions Index reflects answers to an independent survey question; it is not a weighted combination of the components.
The index of expectations for business conditions in six months slipped one point after a 14 point jump in November. Expectations for future capital spending also added to a strong gain in November.
The Empire State Manufacturing Survey is a monthly survey of manufacturers in New York State conducted by the Federal Reserve Bank of New York. Participants from across the state in a variety of industries respond to a questionnaire and report the change in a variety of indicators from the previous month. Respondents also state the likely direction of these same indicators six months ahead. April 2002 is the first report, although survey data date back to July 2001.
For more on the Empire State Manufacturing Survey, including methodologies and the latest report, click here.
| Empire State Manufacturing Survey | Dec | Nov | Dec '04 | 2005 | 2004 | 2003 |
|---|---|---|---|---|---|---|
| General Business Conditions (diffusion index) | 28.74 | 22.82 | 27.07 | 15.59 | 28.76 | 16.17 |
by Tom Moeller December 15, 2005
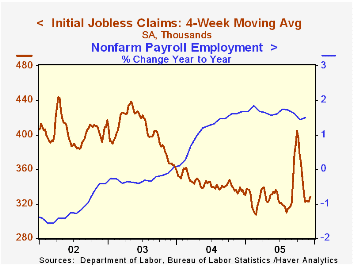
Initial claims for unemployment insurance inched up 1,000 to 329,000 last week following a little revised 7,000 increase the prior week. Consensus expectations had been for 320,000 claims.
Hurricane related claims dropped to 3,000 and brought the total of the three storms during the last fifteen weeks to 603,000.
The four-week moving average of initial claims rose slightly to 328,750 (-1.9% y/y).
Continuing unemployment insurance claims rose 21,000 following a revised 156,000 decline the prior week which was deeper than initially reported.
The insured rate of unemployment was stable at 2.0%.
| Unemployment Insurance (000s) | 12/10/05 | 12/03/05 | Y/Y | 2004 | 2003 | 2002 |
|---|---|---|---|---|---|---|
| Initial Claims | 329 | 328 | 2.5% | 343 | 402 | 404 |
| Continuing Claims | -- | 2,606 | -5.2% | 2,926 | 3,531 | 3,570 |
by Carol Stone December 15, 2005
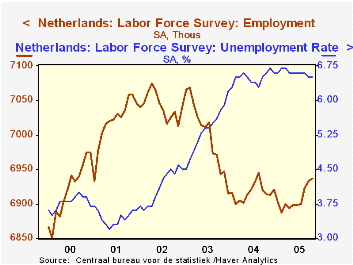
Three diverse countries which reported their latest labor fore data today, have shown improving trends in the last couple of months. In the Netherlands, Sweden and South Korea, the most current unemployment rates have decreased and employment, while not reaching records, also appears to be on a firm uptrend in each region.
In the Netherlands, employment gained 4,000 in October, following an increase of 33,000 in August and September combined. These data are quoted as 3-month centered moving averages. As shown in the first graph, the first half of 2005 saw a flat pattern for employment, so the recent rise is encouraging even though the level remains well below prior years. The Dutch labor force survey only began in 2000, so there is little history to compare. Unemployment has begun an ever so gradual decline after reaching a high of 6.7% in February and March. Although down only 0.2 percentage point, the improvement looks to be sustainable, since it accompanies rising employment, not the "discouraged worker" syndrome of a shrinking labor force. Indeed, using Excel to calculate a labor force participation rate (those in labor force as a percentage of the sum of the labor force and those not in labor force), we find it at 67.44% in September and October, up from a low of 67.16% in April and the highest so far this year.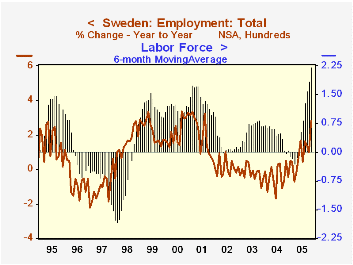
In Sweden, employment was up in November by 117,500 from a year ago, in data that are not seasonally adjusted; this extends a firming trend that began in May and represents 2.8% growth in the number of people with jobs. The unemployment rate, at 5.0% last month, is up 0.1% from the year-ago amount, but it accompanies a participation rate that is also rising and is the highest in more than 3-1/2 years. So, here, as in Holland, people are not backing off from the labor force, but joining it. Indeed, the labor force is growing at a record rate by far. In the second graph, we show a six-month moving average of year-to-year growth rates. For November this was 2.2%, a record for this 30-year-old survey. It looks impressive together with the employment growth, indicating resilience of the Swedish labor market.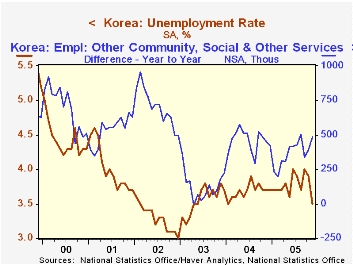
The situation in South Korea looks a bit different than might be expected. Employment is growing, although not as rapidly as before the currency crisis period of the late 1990s or in the immediate recovery from that in 1999 and 2000. At the same time, a broad industry breakdown into manufacturing and services shows that manufacturing jobs are actually declining and have been all this year, so that the November figure is 107,000 below a year earlier. However, the service sector has been expanding by more than enough to make up for that -- 482,000 over the last 12 months. The unemployment rate has thus been able to come down, reaching 3.5% in November, the lowest since January 2004.
| Employment (thous) Unemployment Rate (%) | Nov 2005 | Oct 2005 | Sept 2005 | Year Ago | 2004 | 2003 | 2002 |
|---|---|---|---|---|---|---|---|
| Netherlands*: Employment | -- | 6,937 | 6,933 | 6,914 | 7,037 | 7,114 | 7,125 |
| Unemployment Rate | -- | 6.5 | 6.5 | 6.6 | 6.4 | 5.3 | 4.1 |
| Sweden**: Employment | 4,304 | 4,238 | 4,259 | 4,186 | 4,213 | 4,232 | 4,242 |
| Unemployment Rate | 5.0 | 5.6 | 5.4 | 4.9 | 5.5 | 4.9 | 4.0 |
| South Korea***: Employment | 23,030 | 22,914 | 22,836 | 22,639 | 22,557 | 22,139 | 22,169 |
| Unemployment Rate | 3.5 | 3.9 | 4.0 | 3.7 | 3.7 | 3.6 | 3.3 |

Tom Moeller
AuthorMore in Author Profile »Prior to joining Haver Analytics in 2000, Mr. Moeller worked as the Economist at Chancellor Capital Management from 1985 to 1999. There, he developed comprehensive economic forecasts and interpreted economic data for equity and fixed income portfolio managers. Also at Chancellor, Mr. Moeller worked as an equity analyst and was responsible for researching and rating companies in the economically sensitive automobile and housing industries for investment in Chancellor’s equity portfolio. Prior to joining Chancellor, Mr. Moeller was an Economist at Citibank from 1979 to 1984. He also analyzed pricing behavior in the metals industry for the Council on Wage and Price Stability in Washington, D.C. In 1999, Mr. Moeller received the award for most accurate forecast from the Forecasters' Club of New York. From 1990 to 1992 he was President of the New York Association for Business Economists. Mr. Moeller earned an M.B.A. in Finance from Fordham University, where he graduated in 1987. He holds a Bachelor of Arts in Economics from George Washington University.
More Economy in Brief


