 Global| May 15 2007
CPI Core Remains on the Razor’s Edge
Summary
CPI Headline +0.4% +2.6% y/y. CPI-Core: +0.2% +2.3% y/y. The CPI headline is a touch better than expected. The core at 0.2% is as excepted bringing the Core year/year pace to 2.3% year/year at the boundary of Fed discomfort. It is not [...]
CPI Headline +0.4% +2.6% y/y.
CPI-Core: +0.2% +2.3% y/y.
The CPI headline is a touch better than expected. The core at 0.2% is as excepted bringing the Core year/year pace to 2.3% year/year at the boundary of Fed discomfort.
It is not a report to change monetary policy.
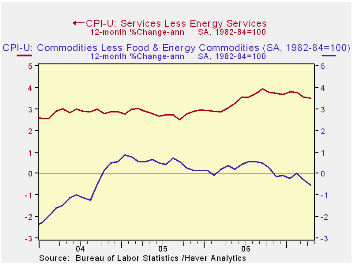
Core Commodities inflation fell by 0.1% on the month while Services core inflation expanded by 0.3%. Year-on-year commodities core inflation is -0.5% while core services inflation is at a stubborn 3.5%.
Medical care inflation popped back up to +0.4% after posting +0.1% last month. Apparel prices fell by 0.3% after a 1% drop last month and are lower by 0.4% year/year. Housing costs were steady at 0.2% for the second month in a row while owner’s equivalent rent fell to +0.2% from +0.3%.
Core CPI goods and services inflation are in declining trends with goods showing a faster pace of decline and service inflation much more stubborn. Diffusion shows that inflation is not accelerating overall. With Total and Core inflation diffusion readings at 46.4 and 42.9 respectively for month/month changes in the item by item inflation rate, we see that inflation itself is decelerating on the month in more CPI and Core categories than it is accelerating.
However, inflation excluding energy has been stuck at a pace of 2.4% to 2.6% for three-, six- and 12-month trends. Excluding tobacco, core inflation is holding just below 2% for three months and six months. Both energy and food inflation remain nettlesome.
This is a report to keep the Fed on guard. With the year/year trends in core services and core goods prices on the decline, the pace of service inflation is still very high… An inflation rate that depends on faster dropping goods prices to offset stubborn services inflation is simply not on strong ground.
| Overview: Moderation is back in play…… | ||||||||
| Quick Summary | Yr/Yr | 6-Mo a.r | 3-Mo a.r | Year-To-Date 2007 2006 |
One Mo. Diffusion |
|||
| CPI | 2.6% | 4.2% | 5.7% | -- | 4.8% | 4.6% | 46.4 | -- |
| Core CPI | 2.4% | 2.0% | 1.9% | -- | 2.2% | 2.8% | 42.9 | -- |
| Commodity Category | Mo a.r | % Wgt | Annualized Inflation Rate For Last: | Mo/Mo Not Annualized |
||||
| By Expenditure Category | April 2007 | -- | 3-Mos | -- | 6-Mos | -- | Year | Apr.2007 |
| All Items | 5.1% | 100.00 | 5.7% | -- | 4.2% | -- | 2.6% | 0.4% |
| By Economic Group | ||||||||
| All: Excl Food & Energy | 2.1% | 77.10 | 1.9% | -- | 2.0% | -- | 2.4% | 0.2% |
| (Median Increase) | 3.4% | 100.00 | 3.4% | -- | 3.5% | -- | 2.9% | 0.3% |
| Excl. Energy | 2.6% | 92.32 | 2.6% | -- | 2.4% | -- | 2.6% | 0.2% |
| Commodities: Excl Food & Energy | -1.5% | 22.77 | -0.5% | (29% of core) | -0.9% | -- | -0.5% | -0.1% |
| Services: Excl Energy | 3.6% | 54.33 | 2.9% | (71% of core) | 3.1% | -- | 3.5% | 0.3% |
| Core CPI less Tobacco | 2.2% | -- | 1.9% | -- | 1.9% | -- | 2.3% | 0.2% |
| Food & Energy | ||||||||
| Energy | 70.9% | 7.68 | 77.7% | -- | 38.0% | -- | 3.1% | 4.6% |
| Food | 5.1% | 15.22 | 6.1% | -- | 4.2% | -- | 3.7% | 0.4% |
| Red values indicated inflation pickup from previous period in table above | ||||||||
by Robert Brusca Empire State Index Bounces BackMay 15, 2007
The Empire State statistics are arrayed below along with a battery of summary statistics. Current readings are still weak, but not anemic. The Future index is firm.
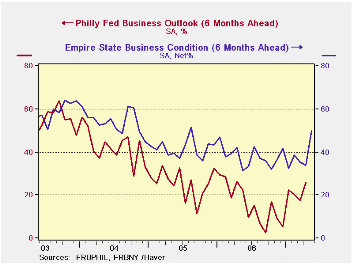
After several months of very weak readings the Empire States survey is beginning to come around. The barometer is still only about half of its 12-month average but it appears to be bouncing back. Orders, shipments, and unfilled orders are each on gradual recovery tracks not just undergoing volatility. Prices received and paid are trendless. Employment and hours worked each appear to be strengthening. The outlook index is up strongly and is at its 12-month average and at the mid point of its range. But prices paid and received in the outlook surveys are very song and if the Fed is paying attention ( to its own survey) this appears to be very bad news.
The outlook chart shows the Philly outlook index Vs the Empire State index. There was a sharp rise in the NY index in May while the Philly index shows signs of a more deeply seeded rebound that has finally gotten in gear.
| General | New | Shipm. | Unfilled | Delivery | Inventory | Prices | Prices | Employ | Avg | Outlook | |
| Business | Orders | Orders | Time | Paid | Received | Hrs | Index | ||||
| May-07 | 8.03 | 8.02 | 14.13 | 0.00 | -4.44 | 0.00 | 34.44 | 15.56 | 9.67 | 11.11 | 49.79 |
| Apr-07 | 3.80 | 3.94 | 8.66 | -8.33 | 1.19 | 7.14 | 40.48 | 7.14 | 5.42 | 1.19 | 33.85 |
| Mar-07 | 1.85 | 3.14 | 18.54 | -8.14 | -4.65 | -4.65 | 30.23 | 10.47 | 11.37 | 12.79 | 35.17 |
| Feb-07 | 24.35 | 18.93 | 27.07 | 0.00 | -3.23 | -7.53 | 26.88 | 12.90 | 12.70 | 5.38 | 38.49 |
| Jan-07 | 9.13 | 10.26 | 16.11 | -8.51 | -5.32 | -19.15 | 35.11 | 19.15 | 6.91 | -1.06 | 32.54 |
| Dec-06 | 22.19 | 22.52 | 27.60 | -14.61 | 1.12 | -7.87 | 28.09 | 13.48 | 18.60 | 7.87 | 41.85 |
| Nov-06 | 25.00 | 21.10 | 26.96 | 0.00 | 4.72 | 3.77 | 34.90 | 16.98 | 23.85 | 10.38 | 36.75 |
| Averages | |||||||||||
| 3mo | 4.56 | 5.03 | 13.78 | -5.49 | -2.63 | 0.83 | 35.05 | 11.06 | 8.82 | 8.36 | 53.30 |
| 6-mo | 11.56 | 11.14 | 18.69 | -6.60 | -2.56 | -5.34 | 32.54 | 13.12 | 10.78 | 6.21 | 52.06 |
| 12-mo | 15.80 | 14.40 | 19.92 | -3.06 | -0.30 | -5.20 | 37.46 | 14.95 | 11.54 | 9.65 | 50.08 |
| Since Jan-02 | |||||||||||
| Max | 38.9 | 38.01 | 44.33 | 20.83 | 12.5 | 8.62 | 60.58 | 27.73 | 23.98 | 29.17 | 68 |
| Min | -17.08 | -9.04 | -2.59 | -19.57 | -15 | -20 | -2.04 | -18.89 | -11.62 | -11.96 | 31.37 |
| Avg | 17.08 | 17.34 | 20.24 | -1.67 | -1.34 | -3.50 | 32.54 | 5.38 | 7.79 | 7.43 | 42.91 |
| % of: | |||||||||||
| Range | 44.9% | 36.3% | 35.6% | 48.4% | 38.4% | 69.9% | 58.3% | 73.9% | 59.8% | 56.1% | 50.3% |
| Ranking | 22.2% | 19.0% | 25.4% | 66.7% | 38.1% | 66.7% | 49.2% | 68.3% | 50.8% | 68.3% | 54.0% |
| raw rank | 49 | 51 | 47 | 21 | 39 | 21 | 32 | 20 | 31 | 20 | 29 |
| out of: | 63 | 63 | 63 | 63 | 63 | 63 | 63 | 63 | 63 | 63 | 63 |
| % of: | FUTURE INDEX SUMMARY STATISTICS | ||||||||||
| Range | 51.0% | 32.3% | 55.7% | 42.6% | 27.2% | 58.5% | 67.4% | 91.8% | 84.0% | 26.9% | 46.8% |
| Ranking | 54.0% | 34.9% | 60.3% | 28.6% | 11.1% | 66.7% | 71.4% | 92.1% | 84.1% | 31.7% | 44.4% |
| raw rank | 29 | 41 | 25 | 45 | 56 | 21 | 18 | 5 | 10 | 43 | 35 |
| out of: | 63 | 63 | 63 | 63 | 63 | 63 | 63 | 63 | 63 | 63 | 63 |
by Louise Curley May 15, 2007
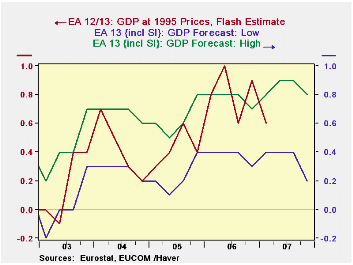
Eurostat issued its flash estimates for GDP growth in the 13 country Euro area and the 27 country European Union. In both cases the estimates showed, as expected, a deceleration from the 0.9% growth in the fourth quarter of 2006 to 0.6% in the first quarter of 2007. The consensus had expected a slightly greater deceleration to 0.5% for the first quarter. In addition to the first quarter flash estimate, Eurostat publishes an estimated range for the second, third and fourth quarters of the year for the GDP growth of the Euro Area. These ranges are shown in the first chart together with the actual flash estimates. The average estimate for the second quarter is 0.65%, the third quarter, 0.65% and the fourth quarter 0.5%. These data are found in the EUROSTAT data base.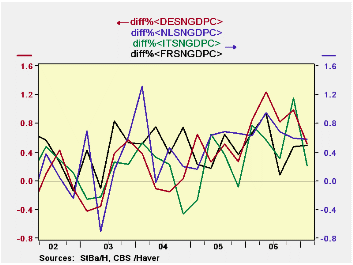
In addition to the flash estimates of percentage changes, published by Eurostat, some countries are beginning to release preliminary details of the composition of GDP for the first quarter. Among the countries of the Euro Area Germany, France, Italy and the Netherlands have published first quarter data, which can be found in the GERMANY, FRANCE, ITALY and BENELUX data bases. First quarter growth in Germany was 0.51%, a surprisingly good showing. Apparently the increase in the Value Added Tax of 3 points had little effect on demand. French growth was only slightly lower at 0.49%.Growth in Italy, however, was only 0.21%. The highest growth of the four was in the Netherlands where GDP grew 0.58% from the fourth quarter of last year to the first quarter of this year. The quarter to quarter growth rates are shown in the second chart.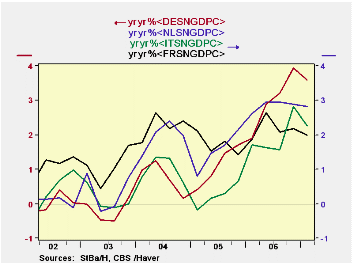
If the year over year growth in the first quarter is any indicator of the likely growth for the year as a whole, the 3.60% growth in Germany, suggests growth in 2007 may well be better than the 2.2% growth in 2006. Similarly, the first quarter growth in Italy suggests a better 2007, The first quarter year over year growth in France, on the other hand, suggests growth in 2007 could be lower than 2006. First quarter year over year growth in the Netherlands was almost equal to average growth in 2006 as can be seen in the table below.The year over year growth rates are shown in the third chart.
| FIRST QUARTER '07 ESTIMATES OF EUROPEAN GDP CHANGE (%) | Q1 07 Q/Q% |
Q4 06 Q/Q% |
Q1 07 Y/Y% |
Q4 06 Y/Y% |
2006 Y/Y% |
2005 Y/Y% |
2004 Y/Y% |
2003 Y/Y% |
|---|---|---|---|---|---|---|---|---|
| Euro Area | 0.6 | 0.9 | -- | -- | -- | -- | -- | -- |
| European Union | ||||||||
| Germany | 0.51 | 0.99 | 3.60 | 2.83 | 2.20 | 1.72 | 2.26 | 1.07 |
| France | 0.49 | 0.48 | 2.00 | 2.18 | 2.99 | 1.10 | 0.77 | -0.20 |
| Italy | 0.21 | 1.15 | 2.25 | 2.83 | 1.94 | 0.23 | 1.02 | 0.11 |
| Netherlands | 0.58 | 0.59 | 2.83 | 2.88 | 2.85 | 1.53 | 1.95 | 0.34 |
by Robert Brusca Japan Core Machinery OrdersMay 15, 2007
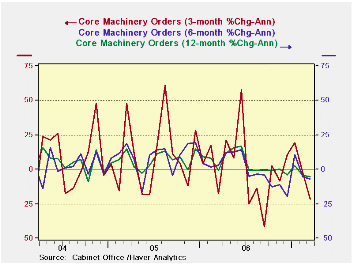
Suddenly Japan’s recovery looks more like a relapse…
The core machinery order trends are as clear as they are depressing. The year/year trend is barely positive, the more-timely 6-month trend is negative and the even timelier 3-month trend is worse still. The silver lining, of course, is that although all those statements are true, things are not spiraling out of control. All three named trends are showing reduced tendencies to decline. Still there is no strength here.
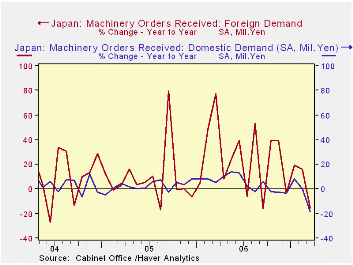
The table below underscores the degree and widespread nature of the weakness. It is in both domestic and foreign orders.
When separated into domestic and foreign components, we find that Japan’s machinery orders are weakening for both venues. Domestic orders have been close to zero for sometime. After some brief strength in 2005 an 2006, they went flat and now are sliding with double-digit declines in year/year rates of growth. Foreign demand, where spikes of strength have peppered past trends have turned smoother and are also sinking rapidly.
March orders are not a bright spot for Japan’s economy.
| m/m % | SAAR % | |||||
| SA | Mar-07 | Feb-07 | Jan-07 | 3-Mos | 6-Mos | 12-Mos |
| Total | -15.7% | 2.8% | 9.3% | -19.6% | -10.4% | -16.5% |
| Core Orders* | -4.5% | -4.9% | 3.6% | -21.6% | -6.8% | -5.4% |
| Foreign Demand | -11.3% | 13.7% | 12.7% | 67.1% | 7.0% | -15.8% |
| Domestic Demand | -20.6% | -2.2% | 7.7% | -51.0% | -31.0% | -18.2% |

Robert Brusca
AuthorMore in Author Profile »Robert A. Brusca is Chief Economist of Fact and Opinion Economics, a consulting firm he founded in Manhattan. He has been an economist on Wall Street for over 25 years. He has visited central banking and large institutional clients in over 30 countries in his career as an economist. Mr. Brusca was a Divisional Research Chief at the Federal Reserve Bank of NY (Chief of the International Financial markets Division), a Fed Watcher at Irving Trust and Chief Economist at Nikko Securities International. He is widely quoted and appears in various media. Mr. Brusca holds an MA and Ph.D. in economics from Michigan State University and a BA in Economics from the University of Michigan. His research pursues his strong interests in non aligned policy economics as well as international economics. FAO Economics’ research targets investors to assist them in making better investment decisions in stocks, bonds and in a variety of international assets. The company does not manage money and has no conflicts in giving economic advice.
More Economy in Brief


