 Global| Apr 20 2005
CPI Boosted by Energy & Services
by:Tom Moeller
|in:Economy in Brief
Summary
Consumer Prices (CPI-U) rose 0.6% in March versus Consensus expectations for a 0.5% rise.Prices less food & energy rose 0.4%, double expectations for a 0.2% increase. Energy prices doubled the prior month's increase with a 4.0% gain [...]
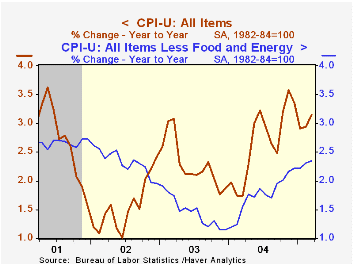
Consumer Prices (CPI-U) rose 0.6% in March versus Consensus expectations for a 0.5% rise.Prices less food & energy rose 0.4%, double expectations for a 0.2% increase.
Energy prices doubled the prior month's increase with a 4.0% gain fueled by a 7.9% (16.8% y/y) jump in gasoline prices. In April gasoline prices have moved higher to an average $2.25 per gallon versus $2.08 in March although in the latest week prices backed off the high of $2.28. Fuel oil prices rose 4.6% (28.2% y/y) but natural gas & electricity prices fell 0.3% (+6.4% y/y).
Services price inflation firmed further last month. Less energy, the 0.5% gain in March was the strongest since November 2001. Shelter prices doubled the prior month's increase with a 0.6% (3.0% y/y) rise and medical care services prices again popped 0.6% (5.0% y/y). Public transportation prices surged 1.3% (0.2% y/y) following three months of flat-to-down movement and school tuition firmed further with a 0.6% (6.4% y/y) rise.
Core goods price inflation again was tame owing to a 0.4% (+0.9%) decline in new vehicle prices, a 0.7% decline (NSA, -15.2% y/y) in computer prices, no change in furniture prices (0.3% y/y) and no change in medical care commodities (2.2% y/y). Apparel prices, however, firmed and rose 0.8% (0.0% y/y).
Food prices rose 0.2%s. Fruit & vegetable prices declined for the fourth straight month (+1.6% y/y) and meat, poultry & fish prices rose 0.2% (2.7% y/y).
The chained CPI which adjusts for shifts in the mix of consumer purchases jumped 0.7%. Core chain prices rose 0.5%.
Has the Bond Market Forgotten Oil? from the Federal Reserve Bank of St. Louis can be found here.
| Consumer Price Index | Mar | Feb | Y/Y | 2004 | 2003 | 2002 |
|---|---|---|---|---|---|---|
| Total | 0.6% | 0.4% | 3.2% | 2.7% | 2.3% | 1.6% |
| Total less Food & Energy | 0.4% | 0.3% | 2.4% | 1.8% | 1.5% | 2.3% |
| Goods less Food & Energy | 0.0% | 0.0% | 0.6% | -0.9% | -2.0% | -1.1% |
| Services less Energy | 0.5% | 0.3% | 3.0% | 2.8% | 2.9% | 3.8% |
| Energy | 4.0% | 2.0% | 12.3% | 10.9% | 12.2% | -5.9% |
| Food | 0.2% | 0.1% | 2.6% | 3.4% | 2.1% | 1.8% |
| Chained CPI: Total (NSA) | 0.7% | 0.5% | 2.6% | 2.3% | 2.0% | 1.3% |
| Total less Food & Energy | 0.5% | 0.6% | 1.9% | 1.5% | 1.1% | 1.9% |
by Tom Moeller April 20, 2005
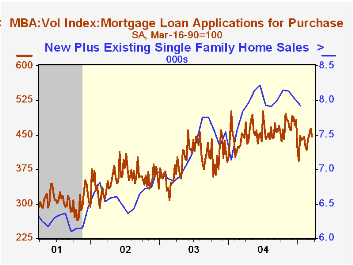
The Mortgage Bankers Association reported that mortgage applications fell 1.6% last week and pulled the average level so far in April 3.5% below March which fell 4.8% from February.
Purchase applications fell 1.6% for the second decline in three weeks. The average in April still is 1.0% ahead of March which rose 6.1% from February. During the last ten years there has been a 50% correlation between the y/y change in purchase applications and the change in new plus existing single family home sales.
Applications to refinance fell 1.6% and the April average is off 9.4% from March.
The effective interest rate on a conventional 30-year mortgage fell to 6.08% from 6.22% the prior week. The effective rate on a 15-year mortgage also fell to 5.70%.
The Mortgage Bankers Association surveys between 20 to 35 of the top lenders in the U.S. housing industry to derive its refinance, purchase and market indexes. The weekly survey accounts for more than 40% of all applications processed each week by mortgage lenders. Visit the Mortgage Bankers Association site here.
| MBA Mortgage Applications (3/16/90=100) | 04/15/05 | 04/08/05 | Y/Y | 2004 | 2003 | 2002 |
|---|---|---|---|---|---|---|
| Total Market Index | 672.6 | 683.6 | -9.7% | 735.1 | 1,067.9 | 799.7 |
| Purchase | 466.7 | 474.5 | 7.5% | 454.5 | 395.1 | 354.7 |
| Refinancing | 1,870.0 | 1,899.6 | -26.7% | 2,366.8 | 4,981.8 | 3,388.0 |
by Carol Stone April 20, 2005
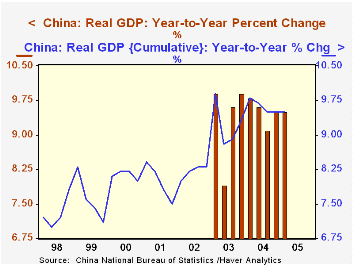
China's GDP gained 9.5% year-on-year in the first quarter, according to data reported this morning in Beijing. This followed a similar performance in Q4 2004, and compared with at least one analyst survey that showed a consensus forecast slowing to 9.0%.
Of the three broad industry groups reported today, two indeed slowed. Growth in the "primary" sector, mainly agriculture, decreased to 4.6% from 5.5% during all of 2004. Even so, these and the previous three quarters remain notably stronger than any pace in the prior six years of these output data.
The services sectors, "tertiary" industries, also retreated somewhat in Q1, expanding 7.6% versus 8.6% during 2004. Both periods, however, have similar rates to those that have prevailed in previous recent years.
"Secondary" industries include mining, manufacturing and utilities. There growth picked up a bit in Q1, to 11.3% from the 10.9% pace in 2004.
Policymakers have hoped for more distinct slowing in growth, and have tightened credit to try to achieve that. So far, their success has obviously been limited. The result of today's GDP report is likely to be continued restraint, and several forecasters today pointed toward still more interest rate increases. The People's Bank of China key 1-year lending rate is presently 5.58%, last raised in October.
| 4-Qtr % Changes | Q1 2005 | Q4 2004 | 2003 | 2002 | 2001 |
|---|---|---|---|---|---|
| Nominal GDP | 15.7 | 15.4 | 22.3 | 7.0 | 5.2 |
| Real GDP | 9.5 | 9.5 | 9.9 | -- | -- |
| Cumulative YTD: Nominal GDP | 15.7 | 17.0 | 14.0 | 6.7 | 7.3 |
| Real GDP | 9.5 | 9.5 | 9.3 | 8.3 | 7.5 |
| Primary Industries* | 4.6 | 5.5 | 2.5 | 2.9 | 2.8 |
| Secondary** | 11.3 | 10.9 | 12.7 | 9.8 | 8.4 |
| Tertiary*** | 7.6 | 8.5 | 7.3 | 8.7 | 8.4 |

Tom Moeller
AuthorMore in Author Profile »Prior to joining Haver Analytics in 2000, Mr. Moeller worked as the Economist at Chancellor Capital Management from 1985 to 1999. There, he developed comprehensive economic forecasts and interpreted economic data for equity and fixed income portfolio managers. Also at Chancellor, Mr. Moeller worked as an equity analyst and was responsible for researching and rating companies in the economically sensitive automobile and housing industries for investment in Chancellor’s equity portfolio. Prior to joining Chancellor, Mr. Moeller was an Economist at Citibank from 1979 to 1984. He also analyzed pricing behavior in the metals industry for the Council on Wage and Price Stability in Washington, D.C. In 1999, Mr. Moeller received the award for most accurate forecast from the Forecasters' Club of New York. From 1990 to 1992 he was President of the New York Association for Business Economists. Mr. Moeller earned an M.B.A. in Finance from Fordham University, where he graduated in 1987. He holds a Bachelor of Arts in Economics from George Washington University.
More Economy in Brief


