 Global| Jan 15 2009
Core Inflation in the EMU and in the US Falling Together...at Last
Summary
The EMU inflation picture was finalized with headline inflation dropping by 0.3% in the month and up by 1.6% Yr/Yr as had been reported in the flash release. With today’s report we get the detail behind the headline. Inflation is [...]
The EMU inflation picture was finalized with headline
inflation dropping by 0.3% in the month and up by 1.6% Yr/Yr as had
been reported in the flash release. With today’s report we get the
detail behind the headline.
Inflation is falling sharply for goods as the progressive
growth rates show over shorter horizons the pace of declines getting
greater. That is not true of services, however, there inflation is
stuck and has even notched up over three-months. Still, for the overall
and core rates inflation is decelerating and for the key headline
series for which the ECB imposes a ceiling, the pace of inflation is
now below that ceiling for 3mo, 6-mo and 12-mo inflation calculations,
but most importantly for the 12-mo series that the ECB emphasizes.
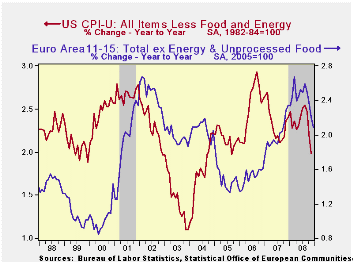
Still we present a graph above showing the core rate compared
with that same rate in the US. For Core inflation the two rates have
had different cycles for this two economic groups and some considerable
divergence in recent years. But now the core, which is as good a short
hand as we have for TREND inflation, is showing a sharp decline for
inflation in the US and well as in EMU.
The most recent synchronous declines in inflation came in 2002
and 2003 with another minor episode in 2005.
Since 2004 US and EMU inflation trends have been doing
different things. Over this period EMU inflation has accelerated until
the recent peaking and deceleration. In the US inflation has mostly
moved sideways during this period but with some considerable
volatility. US Core inflation rose from early through late 2006 before
oscillating in range- a range from which it is now declining. As a
result the current US core inflation rate is the lowest realm we have
seen since mid 2004. For EMU core inflation is only back to late 2007
levels. Even a casual look at the chart and the table above shows why
some ECB hawks have been reluctant to cut rates. EMU core inflation has
been much more in the mode of accelerating than has core inflation in
the US. Even as the headline rate plummets, EMU service sector
inflation is showing some unexpected - and sometimes unrecognized -
resilience. So despite the EMU rate cut we can only wonder how much
these trends will limit flexibility in the ECB monetary policymaking in
the months ahead..
| Trends in HICP | |||||||
|---|---|---|---|---|---|---|---|
| % mo/mo | % saar | ||||||
| Dec-08 | Nov-08 | Oct-08 | 3-Mo | 6-Mo | 12-Mo | Yr Ago | |
| EMU-13 | -0.3% | -0.3% | 0.0% | -2.6% | -0.9% | 1.6% | 3.1% |
| Core | 0.1% | 0.1% | 0.2% | 1.7% | 1.8% | 2.1% | 2.3% |
| Goods | -0.8% | -0.8% | 0.0% | -6.1% | -4.1% | 0.9% | 3.4% |
| Services | 0.8% | -0.1% | 0.1% | 3.3% | 2.6% | 2.6% | 2.5% |
| HICP | |||||||
| Germany | -0.5% | -0.1% | -0.3% | -3.3% | -0.9% | 1.1% | 3.1% |
| France | -0.3% | -0.4% | 0.1% | -2.5% | -1.6% | 1.2% | 2.8% |
| Italy | 0.0% | -0.5% | 0.3% | -0.7% | 0.2% | 2.4% | 2.8% |
| Spain | -0.4% | -0.4% | -0.3% | -4.2% | -1.5% | 1.4% | 4.3% |
| Core excl Food Energy Alcohol | |||||||
| Germany | 0.3% | 0.1% | -0.1% | 1.1% | 1.7% | 1.2% | 2.5% |
| Italy | 0.3% | 0.0% | 0.5% | 3.0% | 2.5% | 2.8% | 2.3% |
| UK | #N/A | 0.2% | 0.0% | #N/A | #N/A | #N/A | 1.8% |
| Spain | 0.1% | 0.1% | 0.1% | 1.3% | 2.2% | 2.4% | 3.4% |

Robert Brusca
AuthorMore in Author Profile »Robert A. Brusca is Chief Economist of Fact and Opinion Economics, a consulting firm he founded in Manhattan. He has been an economist on Wall Street for over 25 years. He has visited central banking and large institutional clients in over 30 countries in his career as an economist. Mr. Brusca was a Divisional Research Chief at the Federal Reserve Bank of NY (Chief of the International Financial markets Division), a Fed Watcher at Irving Trust and Chief Economist at Nikko Securities International. He is widely quoted and appears in various media. Mr. Brusca holds an MA and Ph.D. in economics from Michigan State University and a BA in Economics from the University of Michigan. His research pursues his strong interests in non aligned policy economics as well as international economics. FAO Economics’ research targets investors to assist them in making better investment decisions in stocks, bonds and in a variety of international assets. The company does not manage money and has no conflicts in giving economic advice.
More Economy in Brief


