 Global| Aug 16 2006
Core CPI Moderate As Energy Costs Jumped, Again
by:Tom Moeller
|in:Economy in Brief
Summary
Consumer prices (CPI-U) during July rose an expected 0.4%, the average rate of monthly increase for the last five months. A somewhat more moderate increase, however, was posted by prices less food & energy. The 0.2% increase compared [...]
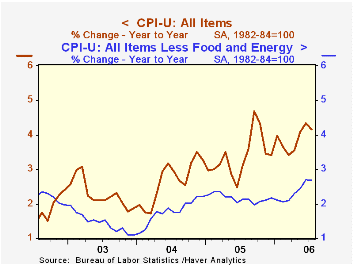
Consumer prices (CPI-U) during July rose an expected 0.4%, the average rate of monthly increase for the last five months. A somewhat more moderate increase, however, was posted by prices less food & energy. The 0.2% increase compared to a 0.3% average of the last five months and was lower than expectations for a 0.3% gain.
The 2.9% m/m spike in energy prices reflected a 5.3% (29.6% y/y) surge in gasoline prices, although weekly gasoline prices have since stabilized in August somewhat at $3.00 per gallon. Natural gas & electricity prices in July ticked up 0.1% (10.5% y/y) after five consecutive months of decline.
Core goods prices fell 0.1% after three months of 0.1% increase. Furniture & bedding costs reversed the prior month's increase with a 0.3% decline (+1.4% y/y) while apparel prices dropped 1.2% (0.0% y/y). Appliance prices increased 0.3% (1.1% y/y) and new & used motor vehicle prices rose 0.2% (0.5% y/y). Tobacco prices were unchanged in July (3.6% y/y) while medical care commodity prices rose 0.3% (3.9% y/y).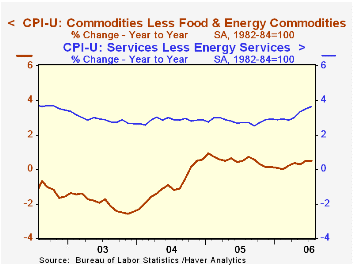
Core services prices rose 0.4%, the same as during the prior two months. Shelter prices increased another 0.4% (3.6% y/y) as the rental equivalence measure of owners' primary residences rose 0.4% (3.7% y/y) and rents also rose 0.4% (3.6% y/y). Public transportation costs moderated somewhat from prior months' strength and increased 0.4% (5.0% y/y).Education cost inflation ticked up to 0.6% (6.0% y/y) but medical care services price inflation dipped to 0.2% (4.0% y/y).
Food & beverage prices rose 0.2% though meat, fish & poultry prices fell 0.6% (+0.2% y/y). Fruit & vegetable prices jumped for the second consecutive month and rose 0.9% (3.7% y/y) while dairy prices ticked up another 0.1% (-0.5% y/y).
The chained CPI, which adjusts for shifts in the mix of consumer purchases, rose 0.1% while less food & energy prices were unchanged last month.
The Effects of Rounding on the Consumer Price Index from the U.S. Bureau of Labor Statistics can be found here.
| Consumer Price Index | July | June | Y/Y | 2005 | 2004 | 2003 |
|---|---|---|---|---|---|---|
| Total | 0.4% | 0.2% | 4.2% | 3.4% | 2.7% | 2.3% |
| Total less Food & Energy | 0.2% | 0.3% | 2.7% | 2.2% | 1.8% | 1.5% |
| Goods less Food & Energy | -0.1% | 0.1% | 0.5% | 0.5% | -0.9% | -2.0% |
| Services less Energy | 0.4% | 0.4% | 3.6% | 2.8% | 2.8% | 2.9% |
| Energy | 2.9% | -0.9% | 20.5% | 16.9% | 10.8% | 12.2% |
| Food & Beverages | 0.2% | 0.3% | 2.2% | 2.4% | 3.4% | 2.1% |
| Chained CPI: Total (NSA) | 0.1% | 0.3% | 3.5% | 2.9% | 2.5% | 2.0% |
| Total less Food & Energy | 0.0% | 0.1% | 2.5% | 1.9% | 1.7% | 1.1% |

Tom Moeller
AuthorMore in Author Profile »Prior to joining Haver Analytics in 2000, Mr. Moeller worked as the Economist at Chancellor Capital Management from 1985 to 1999. There, he developed comprehensive economic forecasts and interpreted economic data for equity and fixed income portfolio managers. Also at Chancellor, Mr. Moeller worked as an equity analyst and was responsible for researching and rating companies in the economically sensitive automobile and housing industries for investment in Chancellor’s equity portfolio. Prior to joining Chancellor, Mr. Moeller was an Economist at Citibank from 1979 to 1984. He also analyzed pricing behavior in the metals industry for the Council on Wage and Price Stability in Washington, D.C. In 1999, Mr. Moeller received the award for most accurate forecast from the Forecasters' Club of New York. From 1990 to 1992 he was President of the New York Association for Business Economists. Mr. Moeller earned an M.B.A. in Finance from Fordham University, where he graduated in 1987. He holds a Bachelor of Arts in Economics from George Washington University.
More Economy in Brief


