 Global| Aug 16 2006
Core CPI Moderate As Energy Costs Jumped, Again
by:Tom Moeller
|in:Economy in Brief
Summary
Consumer prices (CPI-U) during July rose an expected 0.4%, the average rate of monthly increase for the last five months. A somewhat more moderate increase, however, was posted by prices less food & energy. The 0.2% increase compared [...]
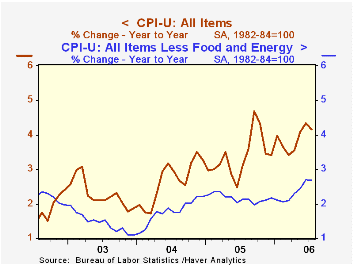
Consumer prices (CPI-U) during July rose an expected 0.4%, the average rate of monthly increase for the last five months. A somewhat more moderate increase, however, was posted by prices less food & energy. The 0.2% increase compared to a 0.3% average of the last five months and was lower than expectations for a 0.3% gain.
The 2.9% m/m spike in energy prices reflected a 5.3% (29.6% y/y) surge in gasoline prices, although weekly gasoline prices have since stabilized in August somewhat at $3.00 per gallon. Natural gas & electricity prices in July ticked up 0.1% (10.5% y/y) after five consecutive months of decline.
Core goods prices fell 0.1% after three months of 0.1% increase. Furniture & bedding costs reversed the prior month's increase with a 0.3% decline (+1.4% y/y) while apparel prices dropped 1.2% (0.0% y/y). Appliance prices increased 0.3% (1.1% y/y) and new & used motor vehicle prices rose 0.2% (0.5% y/y). Tobacco prices were unchanged in July (3.6% y/y) while medical care commodity prices rose 0.3% (3.9% y/y).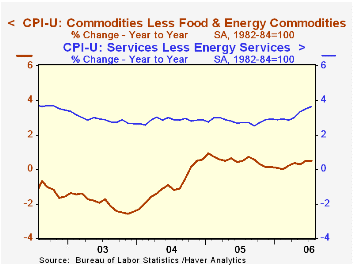
Core services prices rose 0.4%, the same as during the prior two months. Shelter prices increased another 0.4% (3.6% y/y) as the rental equivalence measure of owners' primary residences rose 0.4% (3.7% y/y) and rents also rose 0.4% (3.6% y/y). Public transportation costs moderated somewhat from prior months' strength and increased 0.4% (5.0% y/y).Education cost inflation ticked up to 0.6% (6.0% y/y) but medical care services price inflation dipped to 0.2% (4.0% y/y).
Food & beverage prices rose 0.2% though meat, fish & poultry prices fell 0.6% (+0.2% y/y). Fruit & vegetable prices jumped for the second consecutive month and rose 0.9% (3.7% y/y) while dairy prices ticked up another 0.1% (-0.5% y/y).
The chained CPI, which adjusts for shifts in the mix of consumer purchases, rose 0.1% while less food & energy prices were unchanged last month.
The Effects of Rounding on the Consumer Price Index from the U.S. Bureau of Labor Statistics can be found here.
| Consumer Price Index | July | June | Y/Y | 2005 | 2004 | 2003 |
|---|---|---|---|---|---|---|
| Total | 0.4% | 0.2% | 4.2% | 3.4% | 2.7% | 2.3% |
| Total less Food & Energy | 0.2% | 0.3% | 2.7% | 2.2% | 1.8% | 1.5% |
| Goods less Food & Energy | -0.1% | 0.1% | 0.5% | 0.5% | -0.9% | -2.0% |
| Services less Energy | 0.4% | 0.4% | 3.6% | 2.8% | 2.8% | 2.9% |
| Energy | 2.9% | -0.9% | 20.5% | 16.9% | 10.8% | 12.2% |
| Food & Beverages | 0.2% | 0.3% | 2.2% | 2.4% | 3.4% | 2.1% |
| Chained CPI: Total (NSA) | 0.1% | 0.3% | 3.5% | 2.9% | 2.5% | 2.0% |
| Total less Food & Energy | 0.0% | 0.1% | 2.5% | 1.9% | 1.7% | 1.1% |
by Tom Moeller August 16, 2006
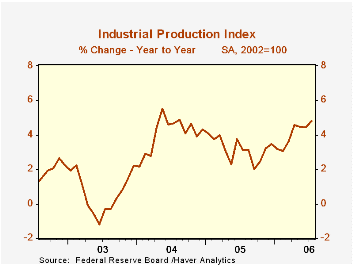
Total U.S. industrial output increased 0.4% last month. The gain was a bit light versus Consensus expectations for a 0.5% rise though it followed an unrevised 0.8% jump during June.
Hot temperatures throughout the country fueled a 2.0% (0.5% y/y) surge in utility output. In fact, cooling degree days during July set a new record high.
Factory sector output rose a more moderate 0.2% following the unrevised 0.8% June jump. The rise lifted the starting point for 3Q 2.5% (AR) above the prior quarter's average.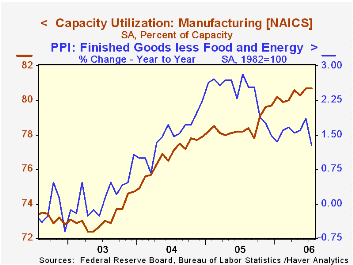
Production of durable consumer goods fell a whopping 3.2% (+1.1% y/y) as output of automotive products dropped 6.2% (-0.5%) and output of appliances & furniture fell for the fourth straight month, down 0.7% (-2.0% y/y. Nondurable consumer goods output increased 0.8% (2.0% y/y) as clothing output jumped 1.7% (8.4% y/y).
Business equipment production surged 1.1% due to a 1.9% (7.7% y/y) spike in output of industrial & other equipment. Production of information processing & equipment also rose a firm 0.9% (19.5% y/y).Factory output overall less the hi-tech industries ticked up just 0.1% (4.6% y/y).
Overall capacity utilization rose to 82.4% in July, its highest level in six years. Factory sector utilization was stable m/m at 80.7%.
| Production & Capacity | July | June | Y/Y | 2005 | 2004 | 2003 |
|---|---|---|---|---|---|---|
| Industrial Production | 0.4% | 0.8% | 4.8% | 3.2% | 4.1% | 0.6% |
| Manufacturing (NAICS) | 0.2% | 0.8% | 5.8% | 3.9% | 4.8% | 0.5% |
| Consumer Goods | -0.3% | 1.1% | 1.8% | 2.1% | 2.1% | 1.0% |
| Business Equipment | 1.1% | 0.8% | 12.2% | 9.1% | 9.3% | 0.0% |
| Capacity Utilization | 82.4% | 82.3% | 80.4% (7/05) | 80.1% | 78.6% | 75.7% |
by Tom Moeller August 16, 2006
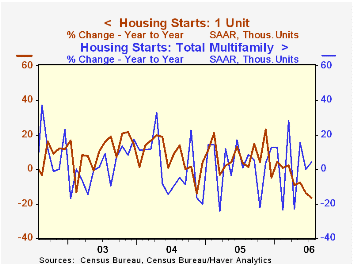
Housing starts fell for the fourth straight month in July, by 2.5% to 1.795M units. The decline slightly outpaced Consensus expectations for drop to 1.81M starts.
Total housing starts in July were 20.8% below the peak this past January.
Single-family starts fell 2.3% last month to 1.453M, down 20.0% from the January peak. Multi family starts also fell another 3.4%.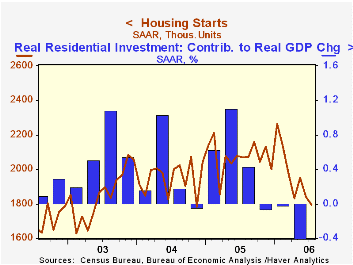
By region, single family housing starts dropped 9.5% (-25.8% y/y) in the West. In the Midwest starts also fell by 2.3% (-18.9% y/y) and single family starts in the South slipped 0.5% (-9.1% y/y). In the Northeast stats rose 12.2% (-26.3% y/y).
Building permits fell for the sixth consecutive month, dropping another 6.5%.
The July 2006 Senior Loan Officer Opinion Survey on Bank Lending Practices from the Federal Reserve Board is available here.
| Housing Starts (000s, AR) | July | June | Y/Y | 2005 | 2004 | 2003 |
|---|---|---|---|---|---|---|
| Total | 1,795 | 1,841 | -13.3% | 2,073 | 1,950 | 1,854 |
| Single-family | 1,452 | 1,486 | -16.6% | 1,719 | 1,604 | 1,505 |
| Multi-family | 343 | 355 | 3.9% | 354 | 345 | 349 |
| Building Permits | 1,747 | 1,869 | -20.8% | 2,159 | 2,058 | 1,888 |
by Tom Moeller August 16, 2006
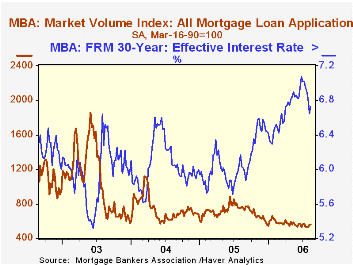
The total number of mortgage applications rose 1.4% last week following a 4.9% rise the week prior.
The gains were led by rebounding applications to refinance which rose 4.6% on top of a 7.1% increase during the first week of August. Refis are up 17.1% from the lows in June.
Conversely, purchase applications last week fell for the fourth week in the last five and posted a 0.8% dip which pulled purchase apps in August 2.5% below the July average.
During the last ten years there has been a 58% correlation between the y/y change in purchase applications and the change in new plus existing single family home sales.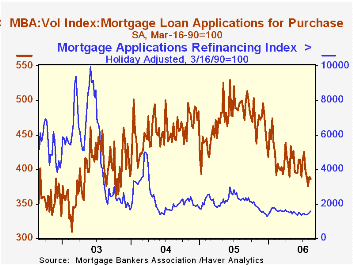
The effective interest rate on a conventional 30-year mortgage increased to 6.73%. The peak for 30 year financing was 7.08% late in June. The rate on 15-year financing also rose to 6.42% and the peak rate was 6.75%. Interest rates on 15 and 30 year mortgages are closely correlated (>90%) with the rate on 10 year Treasury securities.
During the last ten years there has been a (negative) 79% correlation between the level of applications for purchase and the effective interest rate on a 30-year mortgage.
In July, 35.4% of all loan applications were to refinance, down from 44.2% last July.
The Mortgage Bankers Association surveys between 20 to 35 of the top lenders in the U.S. housing industry to derive its refinance, purchase and market indexes. The weekly survey accounts for more than 40% of all applications processed each week by mortgage lenders. Visit the Mortgage Bankers Association site here.
Property Debt Burdens from the Federal Reserve Bank of San Francisco can be found here.
| MBA Mortgage Applications (3/16/90=100) | 08/11/06 | 08/04/06 | Y/Y | 2005 | 2004 | 2003 |
|---|---|---|---|---|---|---|
| Total Market Index | 561.2 | 553.3 | -26.3% | 708.6 | 735.1 | 1,067.9 |
| Purchase | 385.9 | 388.9 | -22.7% | 470.9 | 454.5 | 395.1 |
| Refinancing | 1,587.5 | 1,518.1 | -30.5% | 2,092.3 | 2,366.8 | 4,981.8 |
by Carol Stone August 16, 2006
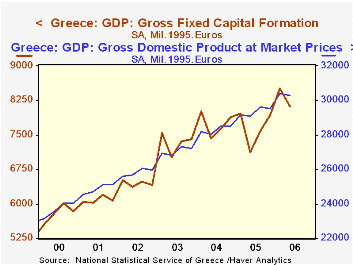
Three Mediterranean regions reported Q2 GDP today. In Greece, total GDP eased 0.3% from Q1, Israel saw growth of 1.5% and the Palestinian Territories' GDP fell 1.7%.
The Greek data featured a decline in domestic demand in Q2 after it rose sharply in Q1. The Q2 figures included a reduction in consumption and what might be termed a "correction" in fixed investment. This latter had been up strongly for three quarters running, so the latest period's decrease still left year-on-year growth of 14.0%, a nice recovery after a contraction in 2005. Consumption is somewhat steadier, maintaining four-quarter growth rates between 3% and 4%. Q2 total GDP was supported by an improvement in net exports. Country-source data for Greece are included in Haver's ALPMED database, with summary statistics in G10 and EUROSTAT. While the first two are updated by Haver soon after the data are released, the figures in EUROSTAT are available to us only after their staff have released them through their own channels and that database generally includes them some time later.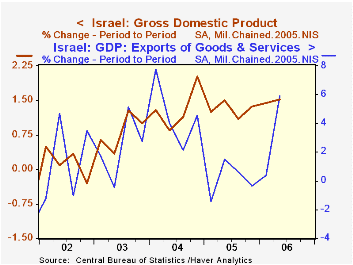
Israel's total GDP growth has been fairly steady at about a 6% annual pace for the last year, reflecting moderate gains in consumption and investment and strong exports. Obviously, these are Q2 data and do not cover any of the Israel/Hezbollah conflict, which began July 12. While economic impact is hardly a high priority in analyzing this war right now, the even-tempered performance of Israel's economy going into it will provide for interesting comparisons when Q3 data are produced.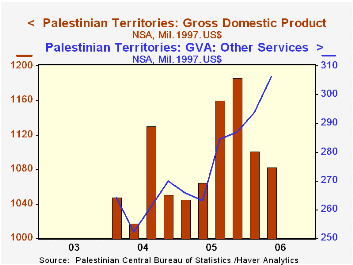
The Palestinian Territories have a tiny economy, with GDP for 2005 totaling only $4.46 billion in fixed 1997 prices. The first two quarters of this year were weak, with a steep drop of 7.2% in Q1 followed by 1.7% in Q2. Recent data are available only for industrial sectors (not for expenditure categories), and these sectors are experiencing varied patterns. The latest declines came in industry and construction, while transportation is erratic but maintaining a modest growth trend. As with many of the world's organized economic areas, the service sector is expanding with some vigor, and Q2 was up 16.5% from a year ago. One hopes that has been maintained this quarter despite the tumult around them.
Data on Israel and the Palestinian Territories are contained in Haver's EMERGEMA database.
| GDP: % Changes | Q2 2006 | Q1 2006 | Q4 2005 | Yr/Yr | 2005 | 2004 | 2003 |
|---|---|---|---|---|---|---|---|
| Greece* | -0.3 | 2.8 | -0.2 | 4.1 | 3.7 | 4.7 | 4.8 |
| Consumption | -1.1 | 1.5 | 0.5 | 3.5 | 3.6 | 4.4 | 3.1 |
| Fixed Investment | -4.7 | 7.4 | 4.5 | 14.0 | -1.2 | 5.7 | 13.7 |
| Israel* | 1.5 | 1.4 | 1.4 | 6.2 | 5.2** | 4.8** | 1.5** |
| Consumption | 1.2 | 1.8 | 0.0 | 2.7 | 3.1** | 2.8** | -0.3** |
| Fixed Investment | -2.4 | 2.2 | 2.2 | 3.1 | 2.9** | 0.3** | -5.5** |
| Palestinian Territories* | -1.7 | -7.2 | 2.3 | 1.7 | 4.9 | -- | -- |

Tom Moeller
AuthorMore in Author Profile »Prior to joining Haver Analytics in 2000, Mr. Moeller worked as the Economist at Chancellor Capital Management from 1985 to 1999. There, he developed comprehensive economic forecasts and interpreted economic data for equity and fixed income portfolio managers. Also at Chancellor, Mr. Moeller worked as an equity analyst and was responsible for researching and rating companies in the economically sensitive automobile and housing industries for investment in Chancellor’s equity portfolio. Prior to joining Chancellor, Mr. Moeller was an Economist at Citibank from 1979 to 1984. He also analyzed pricing behavior in the metals industry for the Council on Wage and Price Stability in Washington, D.C. In 1999, Mr. Moeller received the award for most accurate forecast from the Forecasters' Club of New York. From 1990 to 1992 he was President of the New York Association for Business Economists. Mr. Moeller earned an M.B.A. in Finance from Fordham University, where he graduated in 1987. He holds a Bachelor of Arts in Economics from George Washington University.
More Economy in Brief


