Global| Jan 08 2002
Consumers' Borrowing Surged in November
by:Tom Moeller
|in:Economy in Brief
Summary
Consumer borrowing surged unexpectedly by a record amount in November, spurred by 0% auto financing and a surge in revolving credit. The gain in nonrevolving credit (autos and other personal loans) fell slightly versus October, when [...]
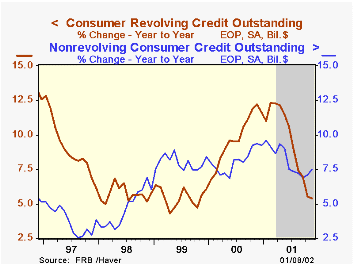
Consumer borrowing surged unexpectedly by a record amount in November, spurred by 0% auto financing and a surge in revolving credit.
The gain in nonrevolving credit (autos and other personal loans) fell slightly versus October, when vehicle sales hit their peak.
Revolving credit surged after four months of weak or negative extension.
| Consumer Credit Outstanding | Nov '01 m/m | Oct '01 m/m | Y/Y | 2000 | 1999 | 1998 |
|---|---|---|---|---|---|---|
| Total | $19.9B | $11.2B | 6.6% | 10.2% | 7.4% | 5.9% |
| Revolving | $5.4B | $-3.5B | 5.4% | 11.6% | 6.1% | 5.8% |
| Nonrevolving | $14.4B | $14.7B | 7.5% | 9.2% | 8.4% | 6.1% |
by Tom Moeller January 8, 2002
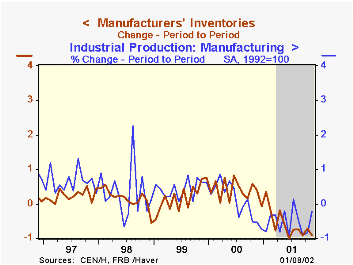
Manufacturing inventories fell for the tenth month in a row by one of the sharper amounts of the correction. The decline in October inventories was nearly doubled.
Inventory decumulation continued strong across industries, but was again notable in the computers and electronic products group, down 16.% since the February peak.
Inventories of automobiles and light trucks were down sharply, though these figures do not much reflect inventories of final product which are held by dealers.
Shipments fell a moderate 0.6% following a 2.3% October surge which was little-revised.
The 4.8% decline in durable goods orders was unrevised from the advance report.
| Nov'01 | Oct '01 | Y/Y | 2000 | 1999 | 1998 | |
|---|---|---|---|---|---|---|
| Mfg Inventories | -0.9% | -0.7% | -6.4% | 4.6% | 2.3% | 1.9% |
by Tom Moeller January 8, 2002
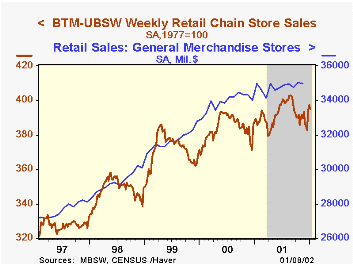
Chain store sales fell just moderately, down 0.6% during New Year's week, following a 0.9% gain the prior week.
Year-to-year comparisons suffered due to a spike in sales during the holidays last year.
January sales began 1.3% above the average of December.
During the last five years there has been a 56% correlation between the annual percent change in chain store sales and retail sales at general merchandise stores.
| BTM-UBSW (SA, 1977=100) | 01/05/02 | 12/29/01 | Y/Y | 2001 | 2000 | 1999 |
|---|---|---|---|---|---|---|
| Total Weekly Retail Chain Store Sales | 395.0 | 397.5 | 1.4% | 2.1% | 3.4% | 6.7% |

Tom Moeller
AuthorMore in Author Profile »Prior to joining Haver Analytics in 2000, Mr. Moeller worked as the Economist at Chancellor Capital Management from 1985 to 1999. There, he developed comprehensive economic forecasts and interpreted economic data for equity and fixed income portfolio managers. Also at Chancellor, Mr. Moeller worked as an equity analyst and was responsible for researching and rating companies in the economically sensitive automobile and housing industries for investment in Chancellor’s equity portfolio. Prior to joining Chancellor, Mr. Moeller was an Economist at Citibank from 1979 to 1984. He also analyzed pricing behavior in the metals industry for the Council on Wage and Price Stability in Washington, D.C. In 1999, Mr. Moeller received the award for most accurate forecast from the Forecasters' Club of New York. From 1990 to 1992 he was President of the New York Association for Business Economists. Mr. Moeller earned an M.B.A. in Finance from Fordham University, where he graduated in 1987. He holds a Bachelor of Arts in Economics from George Washington University.
More Economy in Brief