 Global| Jul 14 2005
Consumer Prices Rose Less Than Expected
by:Tom Moeller
|in:Economy in Brief
Summary
The CPI-U was unchanged last month following a 0.1% decline in May. The figure was below Consensus expectations for a 0.2% increase in June. During the first half of 2005 the CPI rose 3.1% at an annual rate. Energy prices fell 0.5% [...]
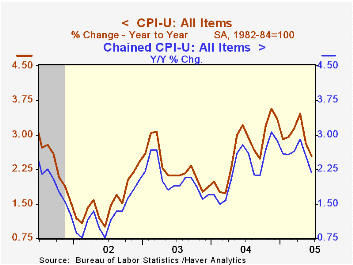
The CPI-U was unchanged last month following a 0.1% decline in May. The figure was below Consensus expectations for a 0.2% increase in June. During the first half of 2005 the CPI rose 3.1% at an annual rate.
Energy prices fell 0.5% led by a 1.2% drop in gasoline prices but gas prices so far in July have more than reversed recent months' declines, rising 5.6% to an average $2.28 per gallon and $2.33 in the latest week. Food prices rose a modest 0.1% for the second month.
Less food & energy prices rose the same 0.1% as in May and during the first six months of this year the core CPI is up 2.2% at an annual rate. Consensus expectations had been for a 0.2% increase in June.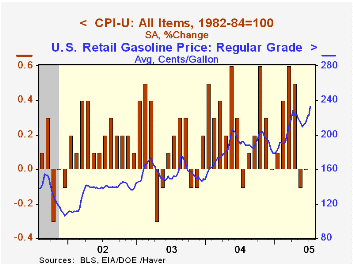
Core goods prices fell for the second month in the last three. The 0.2% decline was led by a 1.3% (-2.8% y/y) drop in furniture & bedding prices and no change (+1.5% y/y) in appliance prices. Apparel prices also fell by 0.7% (-1.5% y/y) and are down 1.0% (AR) so far this year. New motor vehicle prices were unchanged (0.7% y/y) but prices for used cars & trucks rose 0.8% (7.1% y/y).
Core services prices rose a modest 0.2%. Shelter prices rose 0.2% (2.4% y/y) after two months of no change and medical care services prices rose 0.2% (4.8% y/y), the least for any month since April 2003. Public transportation prices were strong for the fourth consecutive month, up 1.2% (4.7% y/y) and school tuition costs rose 0.4% (6.6% y/y).
The chained CPI which adjusts for shifts in the mix of consumer purchases fell 0.1% and less food & energy chain prices fell for the second consecutive month.
| Consumer Price Index | June | May | Y/Y | 2004 | 2003 | 2002 |
|---|---|---|---|---|---|---|
| Total | 0.0% | -0.1% | 2.5% | 2.7% | 2.3% | 1.6% |
| Total less Food & Energy | 0.1% | 0.1% | 2.1% | 1.8% | 1.5% | 2.3% |
| Goods less Food & Energy | -0.2% | 0.2% | 0.5% | -0.9% | -2.0% | -1.1% |
| Services less Energy | 0.2% | 0.1% | 2.7% | 2.8% | 2.9% | 3.8% |
| Energy | -0.5% | -2.0% | 7.4% | 10.9% | 12.2% | -5.9% |
| Food | 0.1% | 0.1% | 2.3% | 3.4% | 2.1% | 1.8% |
| Chained CPI: Total (NSA) | -0.1% | 0.0% | 2.2% | 2.3% | 2.0% | 1.3% |
| Total less Food & Energy | -0.2% | -0.1% | 1.8% | 1.5% | 1.1% | 1.9% |
by Tom Moeller July 14, 2005
US retail sales surged 1.7% last month following a decline in May that was revised slightly shallower to -0.3%. Consensus expectations had been for a 1.0% increase. Sales excluding motor vehicles rose 0.7% and followed an upwardly revised no change in May. Consensus expectations had been for a 0.5% increase.
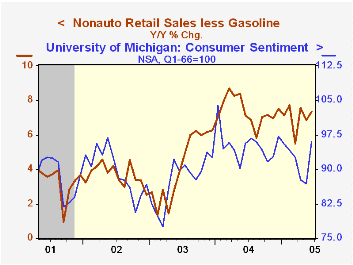
Sales at gasoline service stations rose 1.9% despite lower gas prices. Nonauto retail sales less gasoline rose 0.6% (7.3% y/y) following a 0.1% up tick in May.
During the last ten years there has been a 54% correlation between the level of Consumer Sentiment and the y/y change in nonauto retail sales less gasoline.
Spending on discretionary items was firm. Sales at furniture & electronics stores rose 0.6% (4.6% y/y) and general merchandise store sales jumped 1.2% (8.1% y/y). Apparel store sales recovered the prior month's decline and jumped 1.0% (7.6% y/y).
Building material store sales rose a modest 0.2% (9.3% y/y) following three months of firm gain.
Sales of nonstore retailers (internet and catalogue) more than reversed the prior month's drop and surged 1.7% (11.9% y/y).
| June | May | Y/Y | 2004 | 2003 | 2002 | |
|---|---|---|---|---|---|---|
| Retail Sales & Food Services | 1.7% | -0.3% | 9.6% | 7.3% | 4.3% | 2.5% |
| Excluding Autos | 0.7% | 0.0% | 8.3% | 8.3% | 4.7% | 3.3% |
by Tom Moeller July 14, 2005
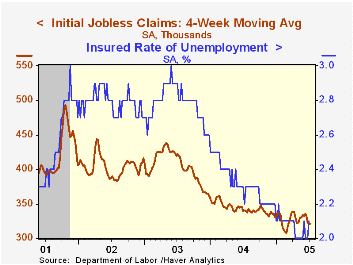
Initial claims for unemployment insurance jumped 16,000 to 336,000 last week after a revised 9,000 increase the week earlier. Consensus expectations had been for 320,000 claims.
During the last ten years there has been a (negative) 75% correlation between the level of initial claims for unemployment insurance and the monthly change in payroll employment. There has been a (negative) 65% correlation with the level of continuing claims.
The four week moving average of initial claims was about stable at 320,750 (-5.7% y/y).
Continuing claims for unemployment insurance jumped 45,000 following a revised 25,000 decline during the prior week.
The insured unemployment rate ticked up to 2.1%.
The Cost of Business Cycles for Unskilled Workers from the Federal Reserve Bank of New York can be found here.
| Unemployment Insurance (000s) | 07/09/05 | 07/02/05 | Y/Y | 2004 | 2003 | 2002 |
|---|---|---|---|---|---|---|
| Initial Claims | 336 | 320 | -2.0% | 343 | 402 | 404 |
| Continuing Claims | -- | 2,617 | -10.7% | 2,926 | 3,531 | 3,570 |
by Carol Stone July 14, 2005
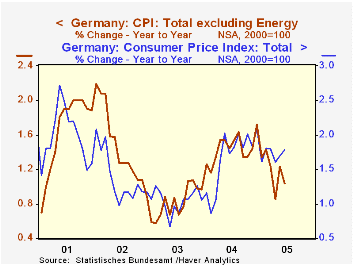
Several countries reported June CPI today, and the results generally suggest that overall inflation remains quiescent. Prices in both Germany and Italy were flat after a 0.3% rise in May, and year-on-year rates four of the six reporting countries, which also include Spain, Finland, New Zealand and the US, remain at or below their pace during 2004.
Inflation is always of interest, but all the more presently because of the surge in energy prices. So we keep checking to see if there has been an acceleration in overall inflation or, if available, in the overall rate excluding energy. This latter is important for showing whether higher energy costs are being pushed through to the prices of other goods and services. In the three countries for which a total excluding energy is published, Germany, Spain and the US, this year/year rate was lower in June than it had been six months ago.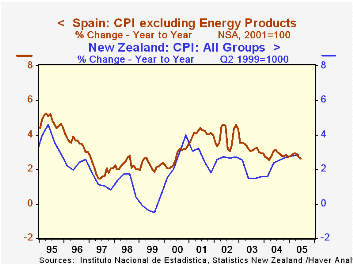
In this same time-period comparison, the 12-month percent change in June versus that for December 2004, we can discern differing trends in non-energy sectors that might help us understand how this moderate inflation is being sustained. Clothing prices are weak in almost every country, and in the places where they are not slowing, they are moving evenly with 2004's pace. Communications prices continue to decline outright, though less rapidly in some countries. Health care costs -- at least the portion covered here, the part consumers actually pay -- are generally rising at about the same rate. Food and household goods prices are mixed among the various reporting countries. Thus, apart from the clothing sector, where weakness is widespread, there is no systematic pattern of price change among the categories and the countries. This randomness is probably beneficial to the prevention of a general acceleration of prices, since it indicates considerable resistance to higher prices in disparate places in the world.
| % Changes; Yr/Yr calculated from NSA | June 2005 | May 2005 | Year/ Year | December/December|||
|---|---|---|---|---|---|---|
| 2004 | 2003 | 2002 | ||||
| Germany (SA) | 0.0 | 0.3 | 1.8 | 3.3 | 1.9 | 2.4 |
| ex Energy (SA) | -0.2 | 0.4 | 1.0 | 1.7 | 1.0 | 0.9 |
| Spain (NSA) | 0.3 | 0.2 | 3.2 | 3.2 | 2.6 | 4.5 |
| ex Energy (NSA) | 0.1 | 0.3 | 2.6 | 2.7 | 2.9 | 4.3 |
| Italy (NSA) | 0.0 | 0.3 | 1.8 | 2.0 | 2.5 | 2.8 |
| Finland (NSA) | 0.3 | -0.3 | 1.1 | 0.4 | 0.6 | 1.7 |
| New Zealand (NSA) | 0.9* | 2.8 | 2.7 | 1.6 | 2.7 | |
| Memo: US (SA) | 0.0 | -0.1 | 2.5 | 3.3 | 1.9 | 2.4 |
| ex Energy (SA) | 0.1 | 0.2 | 2.1 | 2.2 | 1.5 | 1.8 |

Tom Moeller
AuthorMore in Author Profile »Prior to joining Haver Analytics in 2000, Mr. Moeller worked as the Economist at Chancellor Capital Management from 1985 to 1999. There, he developed comprehensive economic forecasts and interpreted economic data for equity and fixed income portfolio managers. Also at Chancellor, Mr. Moeller worked as an equity analyst and was responsible for researching and rating companies in the economically sensitive automobile and housing industries for investment in Chancellor’s equity portfolio. Prior to joining Chancellor, Mr. Moeller was an Economist at Citibank from 1979 to 1984. He also analyzed pricing behavior in the metals industry for the Council on Wage and Price Stability in Washington, D.C. In 1999, Mr. Moeller received the award for most accurate forecast from the Forecasters' Club of New York. From 1990 to 1992 he was President of the New York Association for Business Economists. Mr. Moeller earned an M.B.A. in Finance from Fordham University, where he graduated in 1987. He holds a Bachelor of Arts in Economics from George Washington University.
More Economy in Brief


