 Global| Dec 16 2003
Consumer Prices Fell Broadly
by:Tom Moeller
|in:Economy in Brief
Summary
The Consumer Price Index (CPI-U) fell 0.2% (+1.8% y/y) last month after no change in October. It was the first decline in the CPI since April. Consensus expectations were for a 0.1% rise. Less food & energy prices fell 0.1%, the first [...]
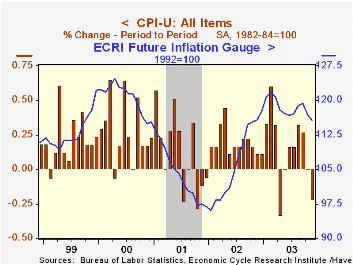
The Consumer Price Index (CPI-U) fell 0.2% (+1.8% y/y) last month after no change in October. It was the first decline in the CPI since April. Consensus expectations were for a 0.1% rise.
Less food & energy prices fell 0.1%, the first monthly decline since December 1982. Consensus expectations for a 0.1% rise.
Deflation in the prices of core consumer goods continued as they fell 0.4% (-2.5% y/y). Apparel prices fell 0.5% (-1.9% y/y). Prices for household furnishings & operation fell 0.3% (-2.3% y/y). New vehicles were unchanged (-2.1% y/y).
Core services prices were unchanged in November as the 0.4% firming in the prior month evaporated. Shelter prices were unchanged m/m (2.2% y/y) after the 0.4% October increase. Public transportation prices fell for the third month in the last four (2.8% y/y). Medical care services prices were strong again, up 0.5% m/m (4.0% y/y).
Energy prices fell 3.0% as gasoline prices dropped 5.0% (5.4% y/y). So far in December gasoline prices have fallen another 2.3% to $1.48/gallon. Piped gas & electricity prices fell 1.4% (6.5% y/y) but fuel oil prices rose 1.1% (+10.7% y/y).
Food prices again were firm last month, up 0.4% (3.2%). Meat prices soared 3.2% (10.6% y/y).
The chained CPI which adjusts for shifts in consumer buying behavior fell 0.4%. It is similar to the PCE price deflator. The core price measure also fell by 0.3%.
| Consumer Price Index | Nov | Oct | Y/Y | 2002 | 2001 | 2000 |
|---|---|---|---|---|---|---|
| Total | -0.2% | 0.0% | 1.8% | 1.6% | 2.8% | 3.4% |
| Total less Food & Energy | -0.1% | 0.2% | 1.1% | 2.3% | 2.7% | 2.4% |
| Goods less Food & Energy | -0.4% | -0.3% | -2.5% | -1.1% | 0.3% | 0.5% |
| Services less Energy | 0.0% | 0.4% | 2.6% | 3.8% | 3.7% | 3.3% |
| Energy | -3.0% | -3.9% | 6.1% | -5.8% | 3.7% | 16.9% |
| Food & Beverages | 0.4% | 0.6% | 3.2% | 1.8% | 3.1% | 2.3% |
| Chained CPI: Total (NSA) | -0.4% | 0.0% | 1.3% | 1.3% | 2.3% | 2.0% |
| Total less Food & Energy | -0.3% | 0.4% | 0.6% | 1.8% | 2.0% | 1.4% |
by Tom Moeller December 16, 2003
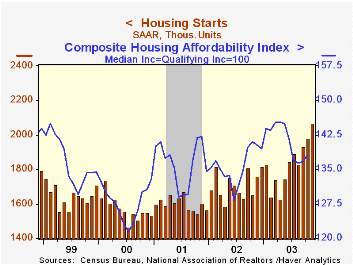
Housing starts jumped 4.5% in November to the highest level since February 1984. Consensus forecasts had been for a moderate decline versus October, which was revised up.
Single family starts rose another 3.3% to another record level of 1.695M units.
Multi-family starts also rose a firm 10.6% and reversed most of the prior month's decline.
Housing starts were notably strong m/m in the Northeast (22.9% y/y) and in the West (35.3% y/y). Starts were up moderately in the Midwest but fell in the South.
Building permits fell 5.4% m/m and reversed all of the prior month's gain.
| Housing Starts (000s, AR) | Nov | Oct | Y/Y | 2002 | 2001 | 2000 |
|---|---|---|---|---|---|---|
| Total | 2,070 | 1,980 | 17.6% | 1,711 | 1,601 | 1,573 |
| Single-family | 1,695 | 1,641 | 20.8% | 1,364 | 1,272 | 1,232 |
| Multi-family | 375 | 339 | 5.0% | 347 | 330 | 341 |
| Building Permits | 1,874 | 1,981 | 6.2% | 1,750 | 1,637 | 1,598 |
by Tom Moeller December 16, 2003
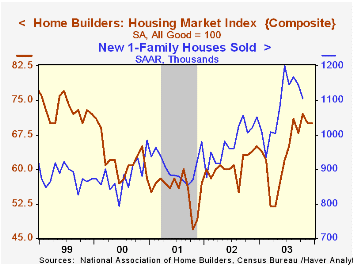
The National Association of Home Builders (NAHB) reported that their Composite Housing Market Index was unchanged in December at 70 (+7.7% y/y) from an upwardly revised November level.
During the last fifteen years there has been a 79% correlation between the y/y change in the NAHB index and the change in single family housing starts.
The index of current market conditions for home sales fell 1.3% m/m to 77 (6.9% y/y).
The index which measures expected home sales in six months dropped for the second month, down 6.2% m/m to 76 (10.1% y/y).
Traffic of prospective buyers improved and recovered most of the November decline.
The NAHB index is a diffusion index based on a survey of builders. Readings above 50 signal that more builders view conditions as good than poor.
Visit the National Association of Home Builders using this link.
| Nat'l Association of Home Builders | Dec | Nov | Y/Y | 2003 | 2002 | 2001 |
|---|---|---|---|---|---|---|
| Composite Housing Market Index | 70 | 70 | 65 | 64 | 61 | 56 |
by Tom Moeller December 16, 2003
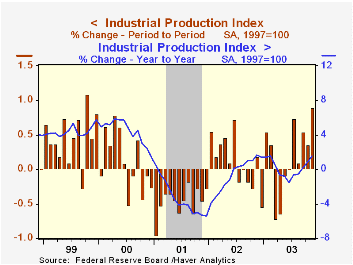
Industrial production surged 0.9% in November, nearly double Consensus expectations for a 0.5% gain.
Factory sector boomed 0.9% (1.9% y/y) and the prior month was revised up to a 0.3% gain. It was the strongest monthly increase in factory output since August 1999.
Output in selected high-technology industries surged another 4.1% (27.5% y/y) after the 4.0%, upwardly revised October jump. Output of computers and peripheral equipment jumped 2.6% (15.1% y/y) and output of semiconductors & related equipment skyrocketed 6.2% (45.8% y/y). Output of communications equipment rose a paltry 1.0% (7.8% y/y).
"Taking the Pulse of the Tech Sector: A Coincident Index of High-Tech Activity" from the Federal Reserve Bank of New York can be found here.
Excluding high-tech, factory output rose 0.7% (0.3% y/y) and the slight October decline was revised to a slight increase. Electrical equipment & appliance outputrose 1.1% (0.4% Y/Y) and furniture output jumped 1.7% (-1.6% y/y). Output of motor vehicles & parts fell for the second consecutive month (-0.3% y/y).
Total capacity utilization rose to 75.7%, the highest level since September 2002.
| Production & Capacity | Nov | Oct | Y/Y | 2002 | 2001 | 2000 |
|---|---|---|---|---|---|---|
| Industrial Production | 0.9% | 0.4% | 1.5% | -0.6% | -3.4% | 4.4% |
| Capacity Utilization | 75.7% | 75.1% | 75.4%(11/02) | 75.6% | 77.4% | 82.6% |
by Tom Moeller December 16, 2003
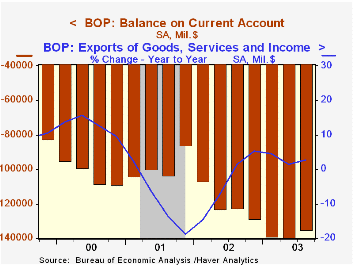
The US current account deficit was shallower last quarter versus the record deficit in 2Q. Nevertheless, the deficit year-to-date is running at a $551B annual rate, up from last year's $480.9B.
The deficit in goods trade improved to $136.2B in 3Q03 but the YTD deficit deteriorated to 547.1B (AR) versus a $482.9B deficit for all of last year and $427.2B in 2001.
Exports of merchandise rose 2.1% (2.0% y/y) following a5.1% decline last year and a 6.9% drop in 2001. Goods imports rose 0.6% (5.5% y/y).
The surplus on services expanded to $14.9B last quarter but the year-to-date surplus of $57.6B (AR) is down from $64.8B last year. The peak services surplus was $91.1B in 1997.
| US Int'l Balance of Payments | 3Q '03 | 2Q '03 | Y/Y | 2002 | 2001 | 2000 |
|---|---|---|---|---|---|---|
| Current Account Deficit | $135.0B | $139.4B | $122.7B | $480.9B | $393.7B | $411.5B |
| Goods/Services/Income Deficit | $118.7B | $122.5B | $108.7B | $422.0B | $347.1B | $355.8B |
| Exports | 3.3% | 0.5% | 5.0% | -4.3% | -9.3% | 12.8% |
| Imports | 1.5% | 0.6% | 4.3% | 1.2% | -7.9% | 18.2% |
| Unilateral Transfers Deficit | $16.3B | $16.9B | $15.9B | $58.9B | $46.6B | $55.7B |

Tom Moeller
AuthorMore in Author Profile »Prior to joining Haver Analytics in 2000, Mr. Moeller worked as the Economist at Chancellor Capital Management from 1985 to 1999. There, he developed comprehensive economic forecasts and interpreted economic data for equity and fixed income portfolio managers. Also at Chancellor, Mr. Moeller worked as an equity analyst and was responsible for researching and rating companies in the economically sensitive automobile and housing industries for investment in Chancellor’s equity portfolio. Prior to joining Chancellor, Mr. Moeller was an Economist at Citibank from 1979 to 1984. He also analyzed pricing behavior in the metals industry for the Council on Wage and Price Stability in Washington, D.C. In 1999, Mr. Moeller received the award for most accurate forecast from the Forecasters' Club of New York. From 1990 to 1992 he was President of the New York Association for Business Economists. Mr. Moeller earned an M.B.A. in Finance from Fordham University, where he graduated in 1987. He holds a Bachelor of Arts in Economics from George Washington University.
More Economy in Brief


