 Global| Jun 15 2005
Consumer Price Inflation Eased
by:Tom Moeller
|in:Economy in Brief
Summary
The CPI-U fell 0.1% in May, the first m/m decline since last July and compared to Consensus expectations for a 0.1% rise. During the first five months of 2005 the CPI is up 4.7% at an annual rate. Pricing power less food & energy [...]
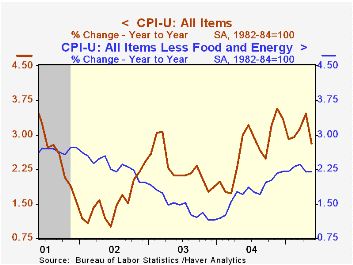
The CPI-U fell 0.1% in May, the first m/m decline since last July and compared to Consensus expectations for a 0.1% rise. During the first five months of 2005 the CPI is up 4.7% at an annual rate.
Pricing power less food & energy continued modest. A 0.1% increase followed no change in April and during the first five months of this year the core CPI is up 2.4% at an annual rate. Consensus expectations had been for a 0.2% May increase.
The 0.2% increase in core goods prices recovered some of April's decline led by a 0.5% m/m gain in used car & truck prices and a 0.5% gain in medical care commodities. Apparel prices were unchanged (-0.8% y/y) following April's 0.6% decline and home furnishings & operation prices rose 0.6% (1.1% y/y) due to strength in the "other" category. New motor vehicle prices rose 0.1% (0.9% y/y).
Services price inflation eased from the low reading in April. Shelter prices were unchanged for the second consecutive month (2.4% y/y) and medical care services prices rose the same 0.3% as during April (5.0% y/y). Public transportation prices were strong for the third consecutive month though the 0.7% gain (3.5% y/y) was down from 1.7% and 1.3% during the prior two months. School tuition costs firmed 0.7% (6.7% y/y).
Energy prices fell 2.0% led by a 4.4% drop in gasoline prices which have fallen another 1.8% so far in June to an average $2.12 per gallon.
Food price inflation eased to 0.1% following the 0.7% jump in April.
The chained CPI which adjusts for shifts in the mix of consumer purchases was unchanged and less food & energy chain prices fell 0.1%.
| Consumer Price Index | May | April | Y/Y | 2004 | 2003 | 2002 |
|---|---|---|---|---|---|---|
| Total | -0.1% | 0.5% | 2.8% | 2.7% | 2.3% | 1.6% |
| Total less Food & Energy | 0.1% | 0.0% | 2.2% | 1.8% | 1.5% | 2.3% |
| Goods less Food & Energy | 0.2% | -0.1% | 0.6% | -0.9% | -2.0% | -1.1% |
| Services less Energy | 0.1% | 0.2% | 2.7% | 2.8% | 2.9% | 3.8% |
| Energy | -2.0% | 4.5% | 9.8% | 10.9% | 12.2% | -5.9% |
| Food | 0.1% | 0.7% | 2.4% | 3.4% | 2.1% | 1.8% |
| Chained CPI: Total (NSA) | 0.0% | 0.5% | 2.5% | 2.3% | 2.0% | 1.3% |
| Total less Food & Energy | -0.1% | 0.2% | 1.8% | 1.5% | 1.1% | 1.9% |
by Tom Moeller June 15, 2005
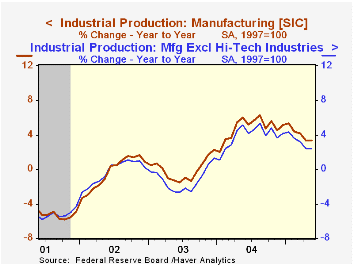
With a 0.3% rise in May, industrial production recovered all of the prior month's deepened 0.3% decline. Consensus expectations had been for a 0.2% gain.
The headline figure masked a sharper improvement in factory sector output which rose 0.6% (3.3% y/y) following two months of modest decline. Scattered industry gains were strongest for machinery (6.7% y/y), electrical equipment (2.2% y/y) aerospace (7.9% y/y) and high tech (19.5% y/y). Excluding the high tech sector factory output rose 0.4% (2.3% y/y) and reversed the decline during the prior two months.
Motor vehicle output rose a slight 0.1% (+1.4% y/y) following two months of sharp decline. Output of furniture fell 0.2% (-3.6% y/y), the fourth monthly decline this year.
Total capacity utilization rose to 79.4% and capacity grew 1.2% y/y. Factory sector utilization rose to 78.2% versus 76.7% last May and capacity rose 1.4% y/y.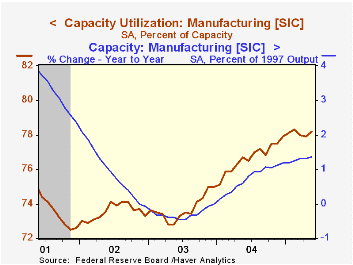
| Production & Capacity | May | April | Y/Y | 2004 | 2003 | 2002 |
|---|---|---|---|---|---|---|
| Industrial Production | 0.3% | -0.3% | 2.7% | 4.1% | -0.0% | -0.3% |
| Consumer Goods | 0.5% | -0.9% | 1.4% | 2.7% | 0.3% | 1.4% |
| Business Equipment | 0.8% | 1.0% | 8.1% | 9.5% | 1.2% | -7.9% |
| Capacity Utilization | 79.4% | 79.1% | 78.2% (05/04) | 78.1% | 75.5% | 75.3% |
by Tom Moeller June 15, 2005
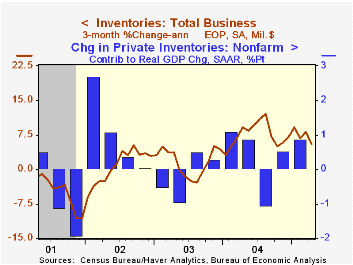
Total business inventories rose just 0.3% in April, the weakest monthly increase this year. The gain lowered the three month change in inventories to 5.5% (AR), less than half the 12.1% peak rate of accumulation through last August. The ratio of inventories-to-sales fell back to the record low of 1.30.
Retail inventories rose 0.2% in April, the same as during a downwardly revised March. The three month change in retail inventories fell to 3.1% versus the peak of 12.4% one year ago. Excluding autos inventories also repeated a 0.2% gain in April and the three month rate of accumulation fell to 3.9% from 11.0% just this past January. Growth in inventories of furniture & electronics dropped to 4.3% from 18.5%, general merchandise inventory accumulation slowed to 7.3% from 12.1% and apparel inventories rose 5.8% versus a three month rate of gain of 12.2% through March.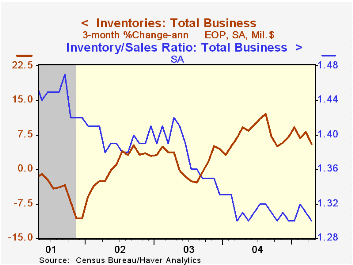
Factory sector inventories ticked up just 0.1% in April and three month growth fell to 5.8%, half the three month rate in March.
Wholesale inventories rose a strong 0.8% but here too the three month growth rate of 8.2% is less than half last summer's peak rate of gain. During the last ten years there has been a 64% correlation between the y/y change in wholesale inventories and the change in imports of merchandise.
Overall business sales rose a sharp 1.2% (8.3% y/y).
| Business Inventories | April | March | Y/Y | 2004 | 2003 | 2002 |
|---|---|---|---|---|---|---|
| Total | 0.3% | 0.5% | 7.6% | 7.7% | 1.4% | 1.6% |
| Retail | 0.2% | 0.2% | 3.6% | 5.7% | 3.9% | 5.9% |
| Retail excl. Autos | 0.2% | 0.2% | 6.1% | 5.9% | 2.0% | 2.3% |
| Wholesale | 0.8% | 0.6% | 11.8% | 10.8% | 2.0% | 1.2% |
| Manufacturing | 0.1% | 0.7% | 8.6% | 7.5% | -1.3% | -1.8% |
by Tom Moeller June 15, 2005
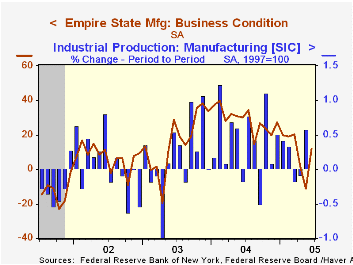
The Empire State Index of General Business Conditions in New York's manufacturing industries turned positive in June with a rise to 11.65 following a one blip into negative territory during May.
The new orders component jumped to +8.23 following two months negative and the shipments index also was slightly positive after two months negative. The employment index recovered but still indicated little if any job growth. Like the Philadelphia Fed Index of General Business Conditions, the Empire State Business Conditions Index reflects answers to an independent survey question; it is not a weighted combination of the components.
The prices paid index fell to the lowest level since last January.
Expectations for business conditions in six months continued the slide which began in late 2003. Expectations for future capital spending dropped sharply to the lowest since April 2003.
The Empire State Manufacturing Survey is a monthly survey of manufacturers in New York State conducted by the Federal Reserve Bank of New York. Participants from across the state in a variety of industries respond to a questionnaire and report the change in a variety of indicators from the previous month. Respondents also state the likely direction of these same indicators six months ahead. April 2002 is the first report, although survey data date back to July 2001.
For more on the Empire State Manufacturing Survey, including methodologies and the latest report, click here.
| Empire State Manufacturing Survey | June | May | June '04 | 2004 | 2003 | 2002 |
|---|---|---|---|---|---|---|
| General Business Conditions (diffusion index) | 11.65 | -11.06 | 30.19 | 28.76 | 16.17 | 7.19 |
by Tom Moeller June 15, 2005
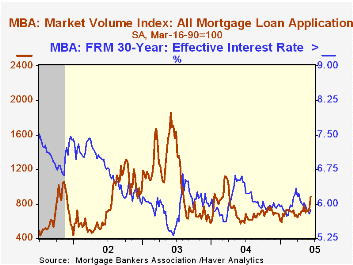
Total mortgage applications surged 17.4% last week following a 6.5% rise the week prior. Applications so far in June are 12.6% ahead of the May average which rose 6.5% versus April, according to the Mortgage Bankers Association.
Applications to refinance rose by one quarter w/w and are 23.8% higher so far in June than in May which rose 11.2% from April.
Purchase applications rose 10.4% w/w and this month are 4.0% ahead of May which rose 3.1% from April. During the last ten years there has been a 50% correlation between the y/y change in purchase applications and the change in new plus existing single family home sales.
The effective interest rate on a conventional 30-year mortgage ticked up to 5.87% from 5.78% the week prior but remained down from the 5.92% averaged during May. The effective rate on a 15-year mortgage rose 10 basis points to 5.51%.
The Mortgage Bankers Association surveys between 20 to 35 of the top lenders in the U.S. housing industry to derive its refinance, purchase and market indexes. The weekly survey accounts for more than 40% of all applications processed each week by mortgage lenders. Visit the Mortgage Bankers Association site here.
| MBA Mortgage Applications (3/16/90=100) | 06/10/05 | 06/03/05 | Y/Y | 2004 | 2003 | 2002 |
|---|---|---|---|---|---|---|
| Total Market Index | 887.0 | 755.5 | 47.7% | 735.1 | 1,067.9 | 799.7 |
| Purchase | 529.3 | 479.3 | 17.8% | 454.5 | 395.1 | 354.7 |
| Refinancing | 2,967.4 | 2,362.1 | 100.6% | 2,366.8 | 4,981.8 | 3,388.0 |
by Carol Stone June 15, 2005
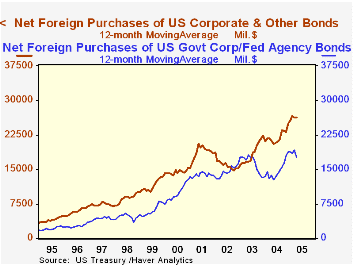
Net purchases of securities by foreign investors in US markets totaled $47.4 billion in April, somewhat larger than March's $40.6 billion. These last two months, however, are well below recent trends, which generated an average of $62.5 billion over the last 12 months and $66.3 billion for 2004.
This most recent slowdown in net purchases has come mainly in federal agency securities, so-called "GSEs" (government-sponsored enterprises). March and April are the weakest two months since mid-2003, and they represent a general flattening of what had been building momentum in this sector until that time in mid-2003 when financial irregularities at Fannie Mae and Freddie Mac came to the fore. Importantly, and in contrast, the pace of net foreign purchases of US Treasuries has been sustained at about $25 billion a month. Corporate debt purchases have continued to trend higher, as evident in the first graph, which shows 12-month averages of corporate bonds along with the flattening pattern of GSE debt purchases.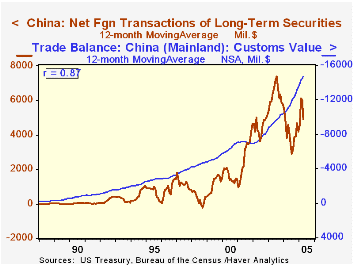
Among countries, monthly movements have been erratic. Japanese investors were net sellers of US securities in February and March, but in April, the beginning of their financial year, they came back in for $11.5 billion worth. This parallels the general pattern in the Japanese data that we discussed here last Friday. China's results are a bit surprising. Those investors were moving rapidly into US securities through mid-2003, but since then have slowed their participation. They sharply reduced purchases of both Treasuries and GSEs, while gradually picking up more corporate bonds. These last, however, remain quite modest. Over the last two years, then, the Chinese purchases of US securities have been smaller, even as their trade surplus with the US has continued to widen.
| Net Foreign Purchases of Securities in US Markets (Billions US$) |
Apr 2005 | Mar 2005 | Feb 2005 | Last 12 Months Average | Monthly Average|||
|---|---|---|---|---|---|---|---|
| 2004 | 2003 | 2002 | |||||
| Total | 47.4 | 40.6 | 84.1 | 62.5 | 66.3 | 56.1 | 47.9 |
| Treasuries | 24.7 | 27.8 | 42.5 | 25.3 | 29.3 | 23.1 | 10.0 |
| Federal Agencies (mostly "GSEs") | 6.7 | 7.5 | 16.1 | 17.6 | 18.9 | 13.3 | 16.3 |
| US Corporate Bonds | 18.0 | 21.9 | 32.0 | 26.3 | 24.8 | 22.3 | 15.2 |
| US Corporate Stocks | 4.3 | 1.7 | 7.4 | 4.5 | 2.3 | 3.0 | 4.2 |
| Foreign Bonds | -4.6 | -3.9 | 1.4 | -3.2 | -2.1 | 1.6 | 2.4 |
| Foreign Stocks | -1.6 | -14.5 | -15.3 | -8.0 | -7.0 | -7.1 | -0.1 |

Tom Moeller
AuthorMore in Author Profile »Prior to joining Haver Analytics in 2000, Mr. Moeller worked as the Economist at Chancellor Capital Management from 1985 to 1999. There, he developed comprehensive economic forecasts and interpreted economic data for equity and fixed income portfolio managers. Also at Chancellor, Mr. Moeller worked as an equity analyst and was responsible for researching and rating companies in the economically sensitive automobile and housing industries for investment in Chancellor’s equity portfolio. Prior to joining Chancellor, Mr. Moeller was an Economist at Citibank from 1979 to 1984. He also analyzed pricing behavior in the metals industry for the Council on Wage and Price Stability in Washington, D.C. In 1999, Mr. Moeller received the award for most accurate forecast from the Forecasters' Club of New York. From 1990 to 1992 he was President of the New York Association for Business Economists. Mr. Moeller earned an M.B.A. in Finance from Fordham University, where he graduated in 1987. He holds a Bachelor of Arts in Economics from George Washington University.
More Economy in Brief


