 Global| Feb 09 2009
Consumer Credit Growth Under Wraps
by:Tom Moeller
|in:Economy in Brief
Summary
The Federal Reserve reported that consumer credit outstanding rose just 1.7% during all of last year. That growth in U.S. credit usage was its lowest since 1993. The slowdown was led by revolving credit outstanding (credit cards), [...]
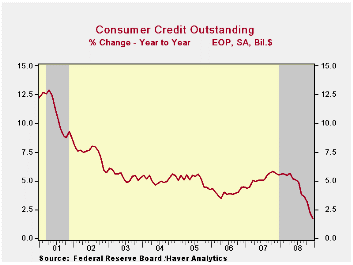
The Federal Reserve reported that consumer credit outstanding rose just 1.7% during all of last year. That growth in U.S. credit usage was its lowest since 1993. The slowdown was led by revolving credit outstanding (credit cards), which fell $6.4 billion during December and the year-to-year growth of 2.6% was its lowest since 2004. Yearend, however, the three-month change was quite a bit weaker. It plummeted to -5.3%, a record rate of decline.
A $6.6 billion December decline in overall consumer credit
outstanding followed a downwardly revised $11.0 billion November drop,
reported last month as an $8.0 billion decline. These latest declines
pulled the three-month growth in credit outstanding to -3.0% (AR) which
was the lowest since the recession of 1990-91.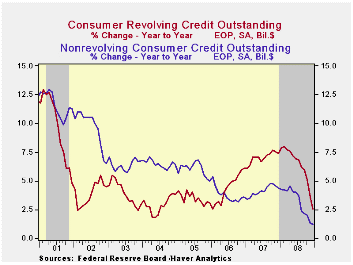
Non-revolving credit (autos & other consumer durables), which accounts for nearly two-thirds of the total, grew just 1.2% last year and in December it dropped for the fourth month in the last five.
These figures are the major input to the Fed's quarterly Flow of Funds accounts for the household sector.
Credit data are available in Haver's USECON database. The Flow of Funds data are in Haver's FFUNDS database.
The Federal Reserve Board on Friday released additional terms and conditions--including loan rates and collateral haircuts--of the Term Asset-Backed Securities Loan Facility (TALF). The Fed's release can be found here.
Raising the credit bar, or getting clubbed by it? from the Federal Reserve Bank of Minneapolis is available here.
| Consumer Credit (m/m Chg, SAAR) | December | November | Y/Y | 2008 | 2007 | 2006 |
|---|---|---|---|---|---|---|
| Total | $-6.6B | $-11.0B | 1.7% | 1.7% | 5.5% | 4.5% |
| Revolving | $-6.4B | $-6.9B | 2.6% | 2.6% | 7.4% | 6.1% |
| Non-revolving | $-0.3B | $-4.2B | 1.2% | 1.2% | 4.4% | 3.6% |
by Louise Curley February 09, 2009
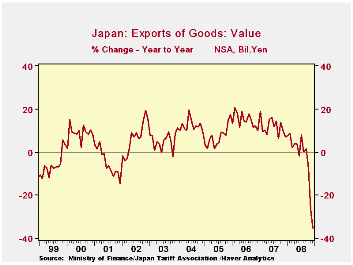
Kazuo Momma, head of Research and Statistics at the Bank of Japan, commented in a recent speech that the Japanese economy may have declined at an "unimaginable speed" in the fourth quarter of last year. Estimates of a seasonally adjusted annual rate of decline as large as 12% are not uncommon. (The official estimate of GDP in the fourth quarter of 2008 is scheduled to be released on February 16th.
 Among the data for the fourth quarter that are now available,
the export sector shows a very speedy decline. Exports were down 8% in
October from a year ago, 27% in November and 35% in December, as shown
in the first chart. While most countries saw their exports decline with
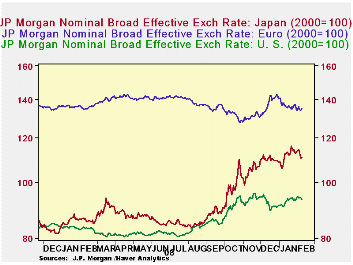
the fall in world demand, a sharp rise in the yen exacerbated the
picture for Japan. The J.P. Morgan Broad Nominal Trade-Weighted
Exchange Rate for Japan is compared with those of the Euro Area and the
United States in the second chart.
Among the data for the fourth quarter that are now available,
the export sector shows a very speedy decline. Exports were down 8% in
October from a year ago, 27% in November and 35% in December, as shown
in the first chart. While most countries saw their exports decline with
the fall in world demand, a sharp rise in the yen exacerbated the
picture for Japan. The J.P. Morgan Broad Nominal Trade-Weighted
Exchange Rate for Japan is compared with those of the Euro Area and the
United States in the second chart. 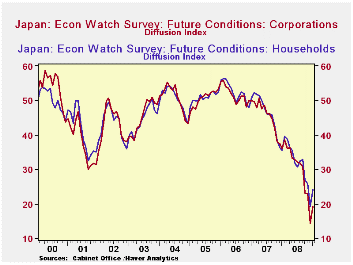 The rise in Japan's trade weighted
exchange rate relative to the others since September stands out.
The rise in Japan's trade weighted
exchange rate relative to the others since September stands out.
The Economy Watchers, who monitor household and corporate activity, published their January report today. While it show some improvement in January, the diffusion indexes for both the households and corporations were at their all time low levels in the fourth quarter of 2008 as shown in the third chart. The January diffusion indexes are still very low at 19.2% for corporations and 24.2% for households.
| JAPAN | Dec 08 | Nov 08 | Oct 08 | Sep 08 | Aug 09 | July 08 | 2008 | 2007 |
|---|---|---|---|---|---|---|---|---|
| Exports (Bil Yen) | 4832.0 | 5325.4 | 6923.8 | 7364.0 | 7053.1 | 7628.7 | 81047.9 | 83931.4 |
| Year to Year % Change (NSA) | -35.0 | -26.7 | -7.8 | 1.5 | 0.3 | 8.0 | -3.33% | 11.54% |
| 12/31/08 | 11/28/08 | 10/30/08 | 9/30/08 | 8/29/08 | 7/31/08 | |||
| J.P. Morgan Nominal Broad Trade Weighted Exchange Rate (2000=100) | 109.1 | 106.9 | 102.1 | 90.1 | 86.1 | 84.1 | -- | -- |

Tom Moeller
AuthorMore in Author Profile »Prior to joining Haver Analytics in 2000, Mr. Moeller worked as the Economist at Chancellor Capital Management from 1985 to 1999. There, he developed comprehensive economic forecasts and interpreted economic data for equity and fixed income portfolio managers. Also at Chancellor, Mr. Moeller worked as an equity analyst and was responsible for researching and rating companies in the economically sensitive automobile and housing industries for investment in Chancellor’s equity portfolio. Prior to joining Chancellor, Mr. Moeller was an Economist at Citibank from 1979 to 1984. He also analyzed pricing behavior in the metals industry for the Council on Wage and Price Stability in Washington, D.C. In 1999, Mr. Moeller received the award for most accurate forecast from the Forecasters' Club of New York. From 1990 to 1992 he was President of the New York Association for Business Economists. Mr. Moeller earned an M.B.A. in Finance from Fordham University, where he graduated in 1987. He holds a Bachelor of Arts in Economics from George Washington University.
More Economy in Brief


