 Global| Jul 29 2008
Consumer Confidence Ticked Up During July
by:Tom Moeller
|in:Economy in Brief
Summary
Consumer confidence, as reported by the Conference Board, ticked up this month by 1.8% after having dropped a revised 12.2% m/m during June. The rise contrasted with Consensus expectations for a moderate decline and it was the first [...]

Consumer confidence, as reported by the Conference Board, ticked up this month by 1.8% after having dropped a revised 12.2% m/m during June. The rise contrasted with Consensus expectations for a moderate decline and it was the first monthly increase this year.
The present conditions index was roughly unchanged from June and remained near the lowest level since 2003.
A slightly improved 13.1% of respondents saw business
conditions as good but that remained near the lowest since early-2003.
Jobs as plentiful were seen by a new low, since 2003, of 13.5% while
30.3% felt that jobs were hard to get. That was the highest since
early-2004. 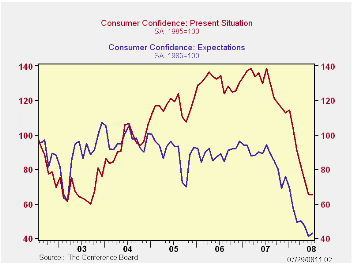
The expectations component of the index ticked up 3.9% and recovered part of the prior month's 12.5% decline.
The percentage of respondents expecting business conditions to worsen in six months slipped to 32.4% and the percentage expecting income to decline was roughly unchanged at 16.0%. Just 8.2% of respondents expected more jobs while 37.1% expected fewer jobs. Only 27.7% of respondents planned to buy a major appliance within six months. That was the lowest since late last year.
Expectations for the inflation rate slipped last month to 7.6% but that was near the highest level in the series' 20 year history.
Consumer Confidence Surveys: Can They Help Us Forecast Consumer Spending in Real Time? is a 2006 article from the Federal Reserve Bank of Philadelphia. It answers "no" and it is available here.
| Conference Board (SA, 1985=100) | July | June | Y/Y % | 2007 | 2006 | 2005 |
|---|---|---|---|---|---|---|
| Consumer Confidence Index | 51.9 | 51.0 | -53.6 | 103.4 | 105.9 | 100.3 |
| Present Situation | 65.3 | 65.4 | -52.8 | 128.8 | 130.2 | 116.1 |
| Expectations | 43.0 | 41.4 | -54.4 | 86.4 | 89.7 | 89.7 |
by Tom Moeller July 29, 2008
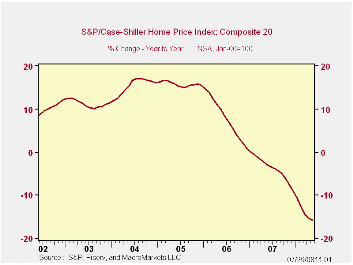
During May the S&P/Case-Shiller Composite 20 home price index fell 1.3% from April. The index was revised up slightly for April but it has fallen during each month since July 2006. Since then prices have fallen 18.4% and by 15.8% during the last twelve months. The series dates back only to 2000.
The Case-Shiller index of 20 U.S. cities and their surrounding areas is not adjusted for the quality or the size of a home.
The Case-Shiller composite index of homes in 10 metropolitan areas, which has a longer history and dates back to 1987, fell 1.0% in May and was down 16.9% year-to-year.
Home prices in Las Vegas, Nevada continued to fall and they were down 28.4% y/y. Prices in Miami also were off 28.3% and home prices in Los Angeles fell 24.5%. In San Diego prices fell 23.2% and they were down 22.9% in San Francisco. Prices in Tampa Florida posted a 20.2% y/y decline.
In New York prices fell a lesser 7.9% and they were down 6.2%
in Boston. In Dallas prices also were off a moderate 3.1% and by only
0.2% in Charlotte, North Carolina.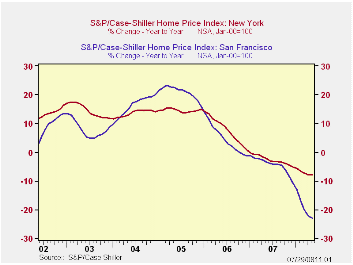
The S&P/Case-Shiller home price series can be found in Haver's USECON database but the city data is in the REGIONAL database.
The latest press release from Standard & Poor's can be found here.
An overview of the S&P/Case-Shiller home price series can be found here.
Whither Federal Reserve Communications is yesterday's speech by Governor Frederic S. Mishkin and it can be found here.
| S&P/Case-Shiller Home Price Index (NSA, Jan 00 = 100) | May | April | Y/Y | 2007 | 2006 | 2005 |
|---|---|---|---|---|---|---|
| 20 City Composite Index | 168.54 | 170.00 | -15.8% | -3.8% | 7.6% | 15.8% |
by Tom Moeller July 29, 2008

Chain store sales were reported by the International Council of Shopping Centers to have surged last week. The 1.2% w/w jump was the strongest since early June. It lifted the level of sales to a record high and sales for most of this month by 0.5% versus June.
During the last ten years there has been a 45% correlation between the y/y change in chain store sales and the change in nonauto retail sales less gasoline.The ICSC-UBS retail chain-store sales index is constructed using the same-store sales (stores open for one year) reported by 78 stores of seven retailers: Dayton Hudson, Federated, Kmart, May, J.C. Penney, Sears and Wal-Mart.
Showing weakness, however, was the leading indicator of chain store sales from ICSC-UBS which fell 0.9% (-4.0% y/y) after a 0.3% decline during the week prior.
The chain store sales figures are available in Haver's SURVEYW database.
Monetary Policy and Asset Markets: Conference Summary from the Federal Reserve Bank of San Francisco can be found here.
Research on the Effects of Fiscal Stimulus: Symposium Summary, also from the Federal Reserve Bank of San Francisco, is available here.
| ICSC-UBS (SA, 1977=100) | 07/26/08 | 07/19/08 | Y/Y | 2007 | 2006 | 2005 |
|---|---|---|---|---|---|---|
| Total Weekly Chain Store Sales | 499.2 | 493.4 | 2.6% | 2.8% | 3.3% | 3.6% |
by Louise Curley July 29, 2008

Consumer Confidence indicators were released today for France, the Netherlands and Slovakia. Business confidence indicators for the Netherlands and Slovakia were also released today. France's Composite Business Climate Indicator was released last week. Both consumers business people in the three countries have become increasingly pessimistic. Consumers have generally been more pessimistic than industrialists as can be seen in the three attached Charts which show consumer and business confidence measures for each country.
Consumer confidence in the Netherlands declined by 12 percentage points in July to -31% from -19% in June. The pessimists in the Netherlands now outweigh the optimists by 31%/ The optimists still exceed the pessimists among the producers, but the margin has been shrinking and now is only 2.4 percentage points.
Consumers are even more pessimistic in France where the percent balance between pessimists and optimists is 48%, up from 46% in June. France's Composite (synthetic) Business Confidence Indicator has fallen below its average level of 100. At 98 it is at the lowest level since April, 2005.
The percent balance between the pessimists and optimists in Slovakia has been increasing but the pessimists exceed the optimists by only 8.8% in contrast to the much bigger differences in France and the Netherlands. The excess of optimists over pessimist in industry has practically disappeared. It is only 0.7%, and is 15.6 percentage points below the excess of optimists in July, 2007.


| CONSUMER AND BUSINESS CONFIDENCE | Jul 08 | Jun 08 | Jul 07 | M/M chg | Y/Y chg | 2007 | 2006 | 2005 |
|---|---|---|---|---|---|---|---|---|
| Netherlands | ||||||||
| Consumer Confidence (% balance) | -31 | -19 | 14 | -12 | -45 | 8 | -1 | -22 |
| Producers Confidence (% balance) | 2.4 | 5.3 | 7.6 | -2.9 | -5.2 | 7.8 | 6.8 | 0.6 |
| France | ||||||||
| Household Confidence (% balance) | -48 | -46 | -15 | -2 | -33 | -21 | -25 | -28 |
| Composite (synthetic Bus Confidence Indicator (Average=100; Std Dev = 10) | 98 | 101 | 109 | -3.0 | -10.1 | 109 | 106 | 100 |
| Slovakia | ||||||||
| Consumer Confidence (% balance) | -8.8 | -6.4 | 2.3 | -2.4 | -11.1 | -1.0 | -9.1 | -14.6 |
| Industry Confidence (% balance) | 0.7 | 2.3 | 16.3 | -1.6 | -15.6 | 12.1 | 7.6 | 4.6 |
by Robert Brusca July 29, 2008
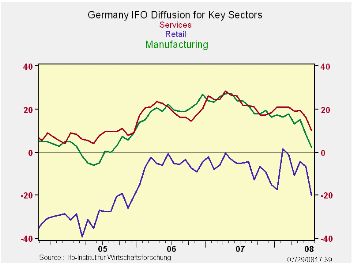
The IFO is showing more weakness in Germany. Today’s report
provides more detail from its earlier release. The current situation
index is still strong residing in the 70th percentile since March of
1992. But expectations are down to the 29th percentile of their range
for that period. Business expectations for the next six months are in
their 33rd percentile for overall MFG. The consumer goods MFG
sub-sector lags the most standing only in the 19th percentile of its
range. The sectors construction, wholesaling and retailing stand in the
45th, 39th and 30th percentiles of their respective ranges. All are
below their respective range midpoints. Only construction is still
above its period average.
The IFO finds that current activity is doing better for MFG
activity at a reading in the 51st percentile of its historic range.
Even so the MFG index is below its historic average. MFG demand is
gauged as weak and is in the 37th percentile of its range. Orders on
hand are in the 38th percentile of their range but foreign orders are
much stronger, in the 81st percentile of their range. Domestic weakness
in orders is being offset by strength from abroad despite the overly
strong euro.
| IFO Survey: Germany | ||||||||
|---|---|---|---|---|---|---|---|---|
| Percent: Yr/Yr | Index Numbers | |||||||
| Jul 08 |
Jun 08 |
May 08 |
Apr 08 |
Mar 08 |
Current | Average | %-ile | |
| Biz Climate | -8.5% | -5.4% | -4.6% | -5.8% | -2.7% | 97.5 | 96.0 | 52.7% |
| Current Situation | -5.1% | -2.7% | -2.1% | -4.2% | -0.7% | 105.7 | 95.5 | 70.0% |
| Biz Expectations | -11.7% | -8.0% | -7.1% | -7.2% | -4.7% | 90.0 | 96.7 | 29.7% |
| average & range since Apr-92 | ||||||||
| Jul08 | Jun 08 |
May 08 |
Apr 08 |
Mar 08 |
Current | Average | %-ile | |
| Biz Climate | -8.5% | -5.4% | -4.6% | -5.8% | -2.7% | 97.5 | 96.0 | 52.7% |
| Current Situation | -5.1% | -2.7% | -2.1% | -4.2% | -0.7% | 105.7 | 95.5 | 70.0% |
| MFG | -5.6% | -4.6% | -2.5% | -3.7% | -1.2% | 105.2 | 93.2 | 80.0% |
| Intermediate goods | -7.0% | -6.6% | -6.9% | -6.9% | -3.7% | 104.2 | 91.8 | 75.9% |
| Capital goods | -3.7% | -2.8% | 2.1% | 1.6% | 1.6% | 108.0 | 93.1 | 85.2% |
| Consumer goods | -6.4% | -4.1% | -1.4% | -4.1% | -0.5% | 101.9 | 96.3 | 65.7% |
| Construction | -2.4% | 0.6% | -1.1% | -2.7% | -4.0% | 111.9 | 103.4 | 63.3% |
| Wholesale | -5.1% | -3.7% | -3.6% | -5.4% | 0.0% | 111.0 | 100.1 | 60.4% |
| Retail | -5.8% | 4.8% | 0.6% | -6.7% | 3.7% | 97.8 | 95.7 | 61.0% |
| Next 6 Mos | ||||||||
| Biz Expectations | Jul 08 |
Jun 08 |
May 08 |
Apr 08 |
Mar 08 |
Current | Average | %-ile |
| MFG | -13.7% | -9.5% | -8.3% | -8.3% | -5.6% | 87.2 | 96.4 | 33.6% |
| Intermediate | -12.0% | -9.1% | -9.2% | -7.0% | -6.6% | 87.2 | 95.8 | 28.2% |
| Capital | -17.7% | -9.0% | -8.4% | -8.7% | -5.1% | 84.7 | 96.3 | 36.5% |
| Consumer | -11.0% | -11.1% | -6.4% | -9.6% | -6.0% | 91.2 | 97.8 | 19.4% |
| Construction | -6.4% | -3.6% | -4.9% | -3.7% | -5.0% | 98.5 | 98.4 | 45.2% |
| Wholesale | -9.8% | -7.4% | -9.2% | -8.9% | -6.1% | 94.7 | 97.2 | 39.3% |
| Retail | -10.1% | -6.0% | -1.5% | -3.9% | 1.5% | 89.6 | 96.1 | 30.5% |
| (m/m) | ||||||||
| Activity(m/m) | Jul 08 |
Jun 08 |
May 08 |
Apr 08 |
Mar 08 |
Current | Average | %-ile |
| MFG | -6.2% | -5.3% | 0.5% | -6.1% | -1.9% | 96.6 | 97.1 | 51.7% |
| Intermediate | -5.0% | -4.8% | -1.9% | -6.6% | -3.8% | 96.0 | 96.4 | 51.8% |
| Capital | -5.7% | -7.0% | 2.9% | -4.2% | 0.4% | 98.4 | 97.3 | 61.4% |
| Consumer | -5.9% | -4.5% | 0.0% | -9.0% | -1.4% | 97.5 | 98.5 | 42.5% |
| Demand M/M | Jul 08 |
Jun 08 |
May 08 |
Apr 08 |
Mar 08 |
Current | Average | %-ile |
| MFG | -9.1% | -9.9% | -2.4% | -11.3% | -4.1% | 92.1 | 97.1 | 37.1% |
| Intermediate | -6.2% | -7.7% | 0.5% | -10.6% | -4.7% | 94.7 | 97.5 | 42.4% |
| Capital | -13.7% | -13.3% | -3.3% | -13.8% | -5.0% | 86.6 | 95.9 | 36.8% |
| Consumer | -9.9% | -10.8% | -3.2% | -7.6% | 0.5% | 94.2 | 96.6 | 37.5% |
| Orders on hand | Jul 08 |
Jun 08 |
May 08 |
Apr 08 |
Mar 08 |
Current | Average | %-ile |
| MFG | -11.0% | -9.8% | -4.7% | -8.8% | -1.0% | 92.7 | 96.5 | 38.8% |
| Intermediate | -8.3% | -7.6% | -1.5% | -9.8% | -3.4% | 94.5 | 96.6 | 42.9% |
| Capital | -16.7% | -14.7% | -9.1% | -10.1% | 0.5% | 88.1 | 95.8 | 37.7% |
| Consumer | -5.4% | -5.4% | -1.5% | -7.2% | 0.5% | 98.4 | 98.6 | 41.3% |
| Foreign orders on hand | Jul 08 |
Jun 08 |
May 08 |
Apr 08 |
Mar 08 |
Current | Average | %-ile |
| MFG | -5.3% | -4.8% | -2.9% | -2.0% | -1.0% | 105.7 | 95.3 | 81.0% |
| Intermediate | -5.4% | -5.9% | -3.9% | -3.9% | -2.9% | 103.3 | 94.3 | 72.9% |
| Capital | -5.4% | -5.9% | -3.2% | 0.9% | 1.4% | 107.9 | 94.4 | 83.9% |
| Consumer | -3.6% | -1.5% | 0.0% | -4.5% | -3.6% | 107.2 | 99.0 | 74.1% |
| Yr/Yr percentage changes in underlying Indices | ||||||||
| IFO outlook for 3-Months ahead | ||||||||
| 3-Mos ahead | ||||||||
| Expected Activity | Jul 08 |
Jun 08 |
May 08 |
Apr 08 |
Mar 08 |
Current | Average | %-ile |
| MFG | -8.0% | -6.5% | -2.8% | -3.2% | -1.9% | 94.9 | 96.9 | 54.2% |
| Intermediate goods | -7.0% | -8.4% | -3.2% | -4.9% | -2.8% | 95.5 | 96.4 | 52.8% |
| Capital goods | -9.4% | -7.0% | -2.2% | -0.9% | -2.8% | 93.5 | 96.7 | 52.7% |
| Consumer goods | -7.0% | -4.2% | -3.8% | -3.7% | -1.3% | 96.6 | 98.3 | 38.0% |
| Orders expectations | Changes over 12-months | |||||||
| Retail Orders Expectations | -13.0% | 1.0% | -4.0% | 2.1% | 6.0% | -24.1 | -17.3 | 44.7% |
| Wholesale | -17.0% | -6.0% | -11.0% | -16.9% | -6.0% | -9.6 | -13.2 | 50.9% |
| EXPORT Biz Expectations | ||||||||
| MFG | -4.3% | -4.7% | -3.8% | -1.8% | -1.5% | 99.2 | 98.6 | 67.0% |
| Intermediate goods | -5.8% | -6.7% | -5.2% | -2.3% | -1.9% | 98.5 | 99.0 | 55.9% |
| Capital goods | -3.3% | -2.9% | -3.7% | 1.0% | -1.9% | 99.2 | 97.8 | 73.9% |
| Consumer goods | -3.8% | -2.4% | -1.0% | -5.2% | -2.4% | 100.1 | 99.2 | 55.6% |
| Employment Expectations | ||||||||
| MFG | -6.2% | -4.7% | -1.5% | -0.5% | -1.6% | 99.9 | 96.4 | 61.6% |
| Intermediate goods | -3.7% | -4.2% | -1.6% | 0.0% | -0.6% | 101.4 | 96.4 | 73.8% |
| Capital goods | -9.6% | -6.6% | -1.0% | -0.5% | -2.5% | 97.6 | 95.5 | 52.7% |
| Consumer goods | -3.0% | -3.1% | 1.0% | -1.5% | -3.1% | 101.3 | 95.1 | 79.6% |

Tom Moeller
AuthorMore in Author Profile »Prior to joining Haver Analytics in 2000, Mr. Moeller worked as the Economist at Chancellor Capital Management from 1985 to 1999. There, he developed comprehensive economic forecasts and interpreted economic data for equity and fixed income portfolio managers. Also at Chancellor, Mr. Moeller worked as an equity analyst and was responsible for researching and rating companies in the economically sensitive automobile and housing industries for investment in Chancellor’s equity portfolio. Prior to joining Chancellor, Mr. Moeller was an Economist at Citibank from 1979 to 1984. He also analyzed pricing behavior in the metals industry for the Council on Wage and Price Stability in Washington, D.C. In 1999, Mr. Moeller received the award for most accurate forecast from the Forecasters' Club of New York. From 1990 to 1992 he was President of the New York Association for Business Economists. Mr. Moeller earned an M.B.A. in Finance from Fordham University, where he graduated in 1987. He holds a Bachelor of Arts in Economics from George Washington University.
More Economy in Brief


