 Global| Sep 26 2006
Consumer Confidence Recovered
by:Tom Moeller
|in:Economy in Brief
Summary
For September, the Conference Board indicated that consumer confidence recovered most of the prior month's drop, which was revised shallower, with a 4.3% increase to 104.5. Consensus expectations had been for a more moderate increase [...]

For September, the Conference Board indicated that consumer confidence recovered most of the prior month's drop, which was revised shallower, with a 4.3% increase to 104.5. Consensus expectations had been for a more moderate increase to 103.
During the last twenty years there has been a 52% correlation between the level of consumer confidence and the y/y change in real consumer spending. The correlation rose to 66% during the last ten years.
Consumers' assessment of the present situation recovered 3.1% (15.7% y/y). The percentage of respondents who viewed business conditions as good (27.4%) rose back to the July level and the percentage that viewed jobs as hard to get (21.3%) rose for the second month.
The index measuring consumers' expectations also recovered the prior month's decline with a 5.5% rise (23.1% y/y). Expectations for better business conditions improved (16.3%) and more respondents expected an increase in jobs (14.4%).
Expectations for the inflation rate in twelve months dropped to 4.9%, the lowest level since March.
The Conference Board’s survey isconducted by a mailed questionnaire to 5,000 households and about 3,500 typically respond.What Happens To Banks When House Prices Fall? U.S. Regional Busts of the 1980s and 1990s from the Federal Reserve Bank of St. Louis is available here.
| Conference Board | September | August | Y/Y | 2005 | 2004 | 2003 |
|---|---|---|---|---|---|---|
| Consumer Confidence | 104.5 | 100.2 | 19.4% | 100.3 | 96.1 | 79.8 |
by Tom Moeller September 26, 2006
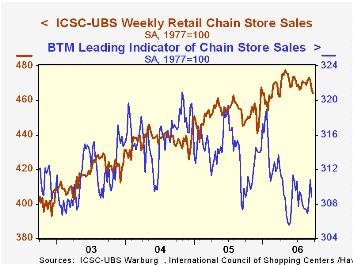
The ICSC-UBS retail chain-store sales index is constructed using the same-store sales (stores open for one year) reported by 78 stores of seven retailers: Dayton Hudson, Federated, Kmart, May, J.C. Penney, Sears and Wal-Mart.
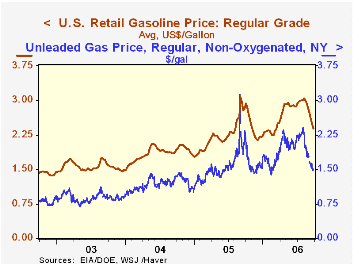
The leading indicator of chain store sales from ICSC-UBS gave back nearly all of the prior period's increase with a 0.6% decline last week (+0.5% y/y).The latest Short-Term Energy Outlook from the U.S. Energy Information Administration is available here.
| ICSC-UBS (SA, 1977=100) | 09/23/06 | 09/16/06 | Y/Y | 2005 | 2004 | 2003 |
|---|---|---|---|---|---|---|
| Total Weekly Chain Store Sales | 464.2 | 466.8 | 4.2% | 3.6% | 4.7% | 2.9% |
by Louise Curley September 26, 2006
Business and consumers in Europe continue to be pleasantly surprised by their current situation, but to be anxious about the future.
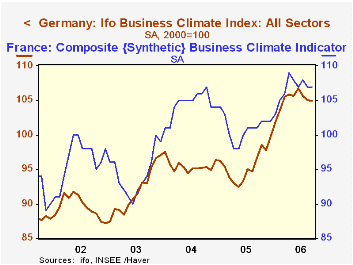
In Germany, the IFO research institute in Munich reported today that its sentiment indicator based on a survey of about 7,000 executives fell to 104.9 (2000=100) from 105.0 in August. It is now 1.8% below the recent peak of 106.8 in June of this year. The sentiment indicator combines the views of business regarding the present situation and those regarding expectations six months ahead. The indicator of the present situation rose 2.4% in September to 111.3 from 108.3 in August and was 15.6% above September, 2005. The expectations indicator, on the other hand, declined 2.5% in September to 98.9 from 101.4 in August and was only 2.2% above September, 2005. The divergence between the Situation and Expectations indexes since midyear is shown in the first chart.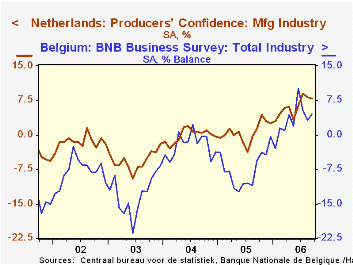
Yesterday, the French INSEE (Institut National de Statistiques et Etudes Economique) announced that its Composite Business Climate Indicator was unchanged at 107 (2000=100) in September from August but was 1.8% below its recent peak of 109 in April of this year. Business sentiment in France has generally been higher than that in Germany as can be seen in the second chart.
Both Belgium and the Netherlands recently released their measures of business and consumer confidence. Belgium is the only country that so far has shown an increase in confidence in September. Both Belgium and the Netherlands express their measures of confidence as a percent balance. The Belgian measure increased from 3.1% to 4.5% in September, however, it is still below its recent peak of 10.1 in June, 2006. It has only been since last fall that the optimists among the Belgian and Dutch business began to exceed the pessimists as can be seen in the third chart.
Consumers in Belgium and the Netherlands have been even more pessimistic than business over the past five years. It was only in June of this year that the optimists outweighed the pessimists in the Netherlands. Pessimists continue to exceed optimists in Belgium, but the margin has narrowed to 2 percentage points in August and September. The fourth chart compares consumer confidence in Belgium and the Netherlands.
Given the improvement in the economy--above expectations--in Europe so far this year, it is not unusual that both business and consumers should express caution regarding the future. So far the confidence measures appear to be signaling just that--caution, not alarm.
| Country | Jul 06 | Jun 06 | Jul 05 | M/M % | Y/Y % | 2005 | 2004 | 2003 |
|---|---|---|---|---|---|---|---|---|
| GERMANY (2000=100 | ||||||||
| Overall | 104.9 | 105.4 | 96.6 | -0.10 | 8.59 | 95.6 | 95.5 | 91.8 |
| Present Situation | 111.3 | 108.7 | 96.3 | 2.39 | 15.58 | 94.7 | 93.1 | 88.1 |
| Expectations | 98.9 | 101.4 | 96.8 | -2.47 | 2.17 | 96.3 | 97.8 | 95.6 |
| FRANCE (2000=100 | ||||||||
| Composite Business Climate Indicator () | 107 | 107 | 101 | 0.00 | 5.94 | 101 | 104 | 94 |
| NETHERLANDS (% Bal) | -- | -- | -- | M/M Dif | Y/Y Dif | -- | -- | -- |
| Business | 7.9 | 8.2 | 6.3 | -0.3 | 9.2 | 0.6 | -0.1 | -5.6 |
| Consumer | 9 | 4 | -26 | 0 | 35 | -22 | -25 | -25 |
| BELGIUM (% Bal) | ||||||||
| Business | 4.5 | 3.1 | -5.6 | 1.4 | 10.1 | -7.5 | -2.3 | -12.9 |
| Consumer | -2 | -2 | -14 | 0 | 12 | -8 | -4 | -11 |

Tom Moeller
AuthorMore in Author Profile »Prior to joining Haver Analytics in 2000, Mr. Moeller worked as the Economist at Chancellor Capital Management from 1985 to 1999. There, he developed comprehensive economic forecasts and interpreted economic data for equity and fixed income portfolio managers. Also at Chancellor, Mr. Moeller worked as an equity analyst and was responsible for researching and rating companies in the economically sensitive automobile and housing industries for investment in Chancellor’s equity portfolio. Prior to joining Chancellor, Mr. Moeller was an Economist at Citibank from 1979 to 1984. He also analyzed pricing behavior in the metals industry for the Council on Wage and Price Stability in Washington, D.C. In 1999, Mr. Moeller received the award for most accurate forecast from the Forecasters' Club of New York. From 1990 to 1992 he was President of the New York Association for Business Economists. Mr. Moeller earned an M.B.A. in Finance from Fordham University, where he graduated in 1987. He holds a Bachelor of Arts in Economics from George Washington University.
More Economy in Brief


