 Global| Jun 24 2008
Consumer Confidence in June Again Fell Surprising Hard
by:Tom Moeller
|in:Economy in Brief
Summary
The Conference Board reported that consumer confidence this month fell by 13.3% m/m after a 7.5% drop in May. The decline nearly equaled the largest since 2005 and it more-than-doubled the decline that was generally expected. The June [...]
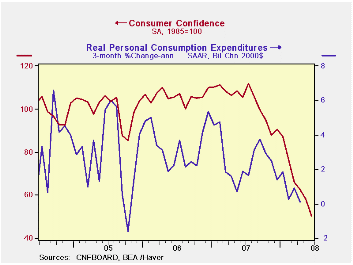
The Conference Board reported that consumer confidence this month fell by 13.3% m/m after a 7.5% drop in May. The decline nearly equaled the largest since 2005 and it more-than-doubled the decline that was generally expected.
The June decline left confidence at its lowest level since
early-1992.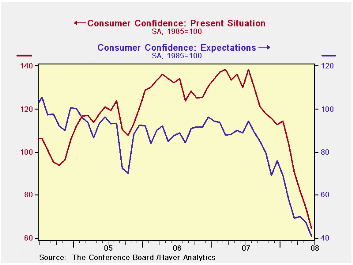
The present conditions index fell 13.1% m/m to the lowest level since 2003.
Just 11.5% of respondents saw business conditions as good, the lowest since early-1992. Jobs as plentiful were seen by a much lessened 14.1% while 30.5% felt that jobs were hard to get, the highest since mid-2004.
The expectations component of the index fell a notably hard 13.3% m/m to a record low. The percentage of respondents expecting business conditions to worsen in six-months rose to 33.9% and the percentage expecting income to decline rose to 15.9%. Only 8.0% of respondents expected more jobs.
Expectations for the inflation rate held steady last month at 7.7%. That was the highest level in the series' 20 year history.
Consumer Confidence Surveys: Can They Help Us Forecast Consumer Spending in Real Time? is a 2006 article from the Federal Reserve Bank of Philadelphia. It answers "no" and it is available here.
| Conference Board (SA, 1985=100) | June | May | Y/Y % | 2007 | 2006 | 2005 |
|---|---|---|---|---|---|---|
| Consumer Confidence Index | 50.4 | 58.1 | -52.1 | 103.4 | 105.9 | 100.3 |
| Present Situation | 64.5 | 74.2 | -50.3 | 128.8 | 130.2 | 116.1 |
| Expectations | 41.0 | 47.3 | -53.8 | 86.4 | 89.7 | 89.7 |
by Tom Moeller June 24, 2008
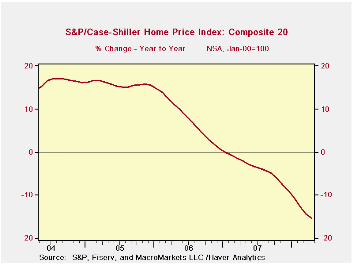
The April S&P/Case-Shiller Composite 20 home price index fell 1.4% m/m and continued its decline from the peak in home prices reached during July 2006. The decline in home prices since that peak totals 17.8% and 15.3% during the last twelve months. The series dates back only to 2000.
For the first quarter overall, home prices fell 6.7% and that was the largest decline since the series peak in 2Q06. Year to year, 1Q prices were down 14.1%.
The Case-Shiller index of 20 U.S. cities and their surrounding
areas is not adjusted for the quality or the size of a home. The home
price index from the Office of Federal Housing Enterprise Oversight
(OFHEO), released last week, does make these adjustments. This series
indicates that during 1Q08 house prices were roughly unchanged y/y but
the purchase-only price index fell 3.1% y/y.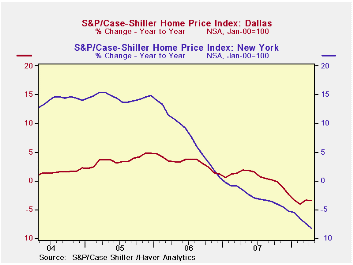
The Case-Shiller composite index of homes in just 10 metropolitan areas has a longer history and dates back to 1987. This measure of prices fell 1.6% in April and was down 16.3% year-to-year.
Home prices in Las Vegas Nevada remained quite weak and were down 26.8% y/y. Prices in Miami were off 26.7% and home prices in Los Angeles were off 23.1%. In San Diego prices fell 22.4% but they were off a lesser 8.4% in New York and by 6.4% in Boston.
In Dallas prices also were off a moderate 3.4% and they were down 0.1% in Charlotte, North Carolina.
| S&P/Case-Shiller Home Price Index (NSA, Jan 00 = 100) | April | March | Y/Y | 2007 | 2006 | 2005 |
|---|---|---|---|---|---|---|
| 20 City Composite Index | 169.85 | 172.20 | -15.3% | -3.8% | 7.6% | 15.8% |
by Tom Moeller June 24, 2008
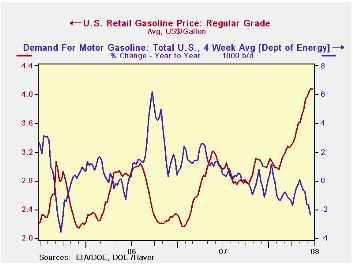
Last week, the retail price for a gallon of regular gasoline remained even with the prior week's level of $4.08 per gallon, according to the U.S. Department of Energy survey. For all grades of gasoline the average price also remained even w/w at an average $4.13 per gallon.
Yesterday, the spot market price for a gallon of regular
gasoline continued about stable with last week's level at $3.30 per
gallon.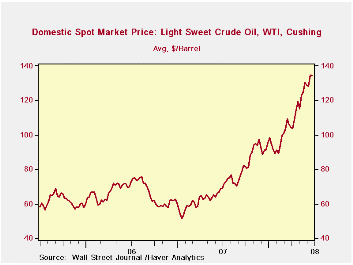
Weekly gasoline prices can be found in Haver's WEEKLY database, daily prices are in the DAILY database.
According to the U.S. Department of Energy the increase in gasoline prices, along with the slowdown in economic growth, have lowered the demand for gasoline during the latest four weeks by 2.4% from a year earlier.
The DOE figures are available in Haver's OILWKLY database.
During all of last week, the price of a barrel of WTI crude oil dipped slightly to an average of $134.37 but yesterday the price moved higher $136.00.
| Weekly Prices | 06/23/08 | 06/16/08 | Y/Y | 2007 | 2006 | 2005 |
|---|---|---|---|---|---|---|
| Retail Regular Gasoline ($ per Gallon) | 4.08 | 4.08 | 36.8% | 2.80 | 2.57 | 2.27 |
| Light Sweet Crude Oil, WTI ($ per bbl.) | 134.37 | 134.73 | 95.7% | 72.25 | 66.12 | 56.60 |
by Louise Curley June 24, 2008
The British Bankers Association (BBA) announced today that
mortgage approvals for house purchases by banks in the United Kingdom
continued to fall in May. At 4,289 million GBP (Great Britain Pounds)
they are now 64% below the peak of 11,811 million GBP reached in
November of 2006. Approvals for re-mortgaging, on the other hand, are
rising. In May they were 9,165 million GBP, more than twice approvals
for house purchases. In the past approvals for refinancing were
generally lower than those for house purchases as can be seen in the
first chart.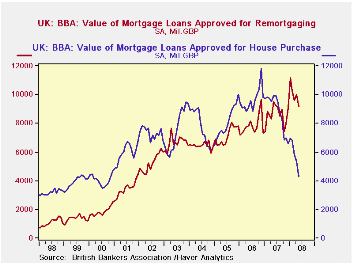
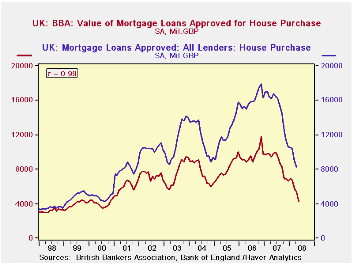
In addition to banks, building societies, non bank credit grantors and specialist mortgage lenders are in the business of providing loans for house purchase and re-mortgaging. The Bank of England publishes data on all the sources of mortgage finance, usually about three weeks after the BBA release. As banks are the major supplier of mortgage credit, there is a close correlation between the two series as can be seen in the second chart.
| UNITED KINGDOM | May 08 | Apr 08 | Mar 08 | Peak | % Chg from peak | 2007 | 2006 | 2005 |
|---|---|---|---|---|---|---|---|---|
| BRITISH BANKERS ASSOCIATION (mil GBP) | ||||||||
| Mortgage Approvals for House Purchase | 4289 | 5354 | 5806 | 11811* | -63.69 | 105727 | 115475 | 97175 |
| Mortgage Approvals for Refinancing | 9165 | 9987 | 9632 | 11160# | -17.88 | 103155 | 94351 | 85802 |
| BANK OF ENGLAND | ||||||||
| Mortgage Approvals for House Purchase | -- | 8268 | 8997 | 17933* | -53.90 | 180494 | 192325 | 146750 |
| Mortgage Approvals for Refinancing | -- | 14133 | 13627 | 15072# | -6.23 | 150744 | 138590 | 128970 |
| * November, 2006 | ||||||||
| # January, 2008 | ||||||||
by Robert Brusca June 24, 2008
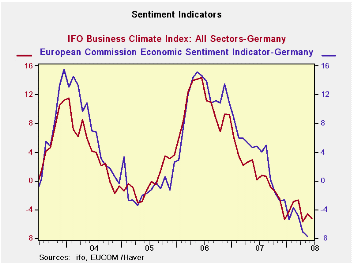
At the crossroads
The IFO business sentiment reading made a deeper Yr/Yr drop in June
than in May. It has slipped to the 68th percentile of its range of
values (range from 1992 to date). The current situation is not as glum
a reading as it stands in the 78th percentile of its range; it is
hardly beleaguered. Yet, it slipped in the month and was lower by 2.8%
Yr/Yr, a bigger drop than May’s 2.1%. But it is the all-important
expectations index that by its very nature is more forwarding looking
and that is a cause for distress. This index fell by 7.9% Yr/Yr more
than the 7.1% registered in May. Its June level stands at the 50.9th
percentile of its range almost exactly mid range. The German economy is
at the crossroads.
The diffusion values show widespread slippage in June with
each of the major sectors lower in June than in May except for
construction. The all-sector climate diffusion index stands at 1.7 down
from 6.1 in May. It stands at the 85.2 percentile much like its pure
index counterpart listed in the table above which is in its 68th
percentile. The sector detail from diffusion data is the only sector
detail available for now.
Climate by sector slipped to 8.2 from 15.0 in MFG dropping
climate to the 61st percentile of its range. Construction is an odd
case at a -18.9 actually stronger than May’s -20.2 and standing in the
74th percentile of its range. Despite the poorer absolute performances
the construction sector is doing relatively better than MFG.
Wholesaling index slipped to 2.1 from 4.0 falling to the 66th
percentile of its range. Retailing registered a weaker -6.5 compared to
-4.4 in May, a range reading of the 80.9 percentile again, an
absolutely weaker sector with a relative standing that is better than
the group average. Services fell to a +16.3 diffusion reading from
+19.4 in May for a percentile standing of 72.4.
Since these are diffusion readings and span positive and
negative values we cannot express drops from their peaks very
effectively. But in terms of the range percentiles we can give some
idea of the slippage. Most of these series peaked in Early 2006 or late
2007. Over this period each was at its own respective cycle high 100th
percentile. So each index has fallen from 100% during this period to
its current reading. These are large drops over a span of 18-months or
less.
The net changes in these various indices the over 18-months
are about half as large as the largest 18-month dropped ever
experienced for all sectors for MFG and for wholesaling. For consumers
the last 18 month’s drop is only one-quarter on the largest ever. For
retail sales and services the drop is on the order of the fifth to
tenth percentile of the largest drop. In terms of monthly variation the
all-sector reading is 17% more variable over the past 18months than
what is normal MFG is 11% more variable. Wholesaling is has been more
variable. But construction has been 20% less variable retailing has
been 15% less variable. Services overall have been 35% less variable.
It has been a bit of a mixed bag but the German consumer and services
sector has been clearly eroding but slowly while MFG has been slipping
more rapidly.
What we have is an economy in transition with most of the
transition coming from manufacturing and wholesaling (trade). The
domestic retail construction and services industries aren’t really hit
that hard although they have been slipping. With banks seeing some
financial stress and turmoil we have to wonder how long before real
estate gets hit since it is a troubled sector internationally and
requires bank financing in most circumstances. Manufacturing shows
weakness and the euro remains strong; how long before it begins to
affect the consumer and services sectors? What of the eroding impact on
the consumer of higher oil prices? The RTC/Reuters indices already how
a bigger hit to services that does the IFO reading. Ultimately, it’s a
question of contagion from a weaker MFG sector and a direct hit from
oil.
| IFO Survey: Germany | ||||||||
|---|---|---|---|---|---|---|---|---|
| Percent: Yr/Yr | Index Numbers | |||||||
| Jun-08 | May-08 | Apr-08 | Mar-08 | Feb-08 | Current | Average | %tile | |
| Biz Climate | -5.3% | -4.6% | -5.7% | -2.7% | -2.8% | 101.3 | 96.1 | 68.6% |
| Current Situation | -2.8% | -2.1% | -4.2% | -0.7% | -1.1% | 108.3 | 95.4 | 78.0% |
| Biz Expectations: Next 6-Mos | -7.9% | -7.1% | -7.2% | -4.7% | -4.4% | 94.7 | 97.0 | 46.3% |
by Robert Brusca June 24, 2008
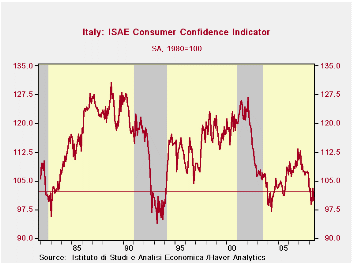
Consumer confidence in Italy in June fell back to a raw
reading of 100 after its unexpected spurt to 103.2 in May. As a result
it is back near its April level of 99 and ensconced at a range
percentile reading of 9.8. That is the reading stands in the bottom 10
percent of its range of values since January of 1999.
If we take the headline of the confidence measure back in time
to 1991 (not all components go back in time as far), we find that it
stands in the bottom 9% of all observations over that longer sample
period. There is no disputing that confidence in Italy is low. 100 is
not a normal reading.
The components of the index are at low percentile in their
respective ranges with a few as really obvious exceptions. The prospect
for unemployment has risen to the 64th percentile (nearly the top THIRD
of its range). The overall situation over the last 12-months grades out
as being in the bottom five percentile of its range; for the next
twelve some improvement is expected as the measure stands in the bottom
36 percentile of its range. Price trends were in the 59th percentile
over the last twelve months and are expected to be essentially at the
40th range percentile in the next 12-months. The household budget in
the next 12-months is shot, standing on the bottom five percent of its
range.
The households’ overall financial situation was and remains
bleak. In the past 12 months households rated their financial situation
as in the bottom 2 percentile of its range; in the next twelve months
it rates at the bottom 3 percentile -- not exactly a party.
The time for major purchases is rated as the WORST EVER
currently. And it is expected to improve only to the bottom 12
percentile in the next 12months.
In the current situation savings behavior is called very
likely- a probable response to the financial uncertainty and to the
fact that is rated as the worst time to buy. So if you do not buy or
spend, you save. In the period ahead the savings environment is in the
bottom 25 percentile of its range.
For Italy the consumer situation remains in distress. The past
twelve months are rated as terrible by consumers. The period ahead is
expected to be still challenging but to show some improvement. It is
hard to say if this is hopeful thinking or a true expected outcome.
| Italy ISAE Consumer Confidence | ||||||
|---|---|---|---|---|---|---|
| Since January 1999 | ||||||
| Jun-08 | May-08 | Apr-08 | Mar-08 | Percentile | Rank | |
| Consumer Confidence | 100 | 103.2 | 99.8 | 99 | 9.8 | 109 |
| Last 12 months | ||||||
| OVERALL SITUATION | -82 | -81 | -85 | -84 | 4.8 | 111 |
| PRICE TRENDS | -11 | -15 | -17 | -17.5 | 59.2 | 52 |
| Next 12months | ||||||
| OVERALL SITUATION | -16 | -9 | -28 | -35 | 36.5 | 55 |
| PRICE TRENDS | 19.5 | 19 | 20 | 23 | 39.8 | 57 |
| UNEMPLOYMENT | -5 | -3 | 3 | 6 | 64.1 | 59 |
| HOUSEHOLD BUDGET | -1 | -3 | 0 | -2 | 5.6 | 110 |
| HOUSEHOLD FIN SITUATION | ||||||
| Last 12 months | -55 | -53 | -56 | -55 | 2.0 | 112 |
| Next12 months | -15 | -10 | -14 | -16 | 3.3 | 113 |
| HOUSEHOLD SAVINGS | ||||||
| Current | 73 | 68 | 58 | 54 | 100.0 | 1 |
| Future | -38 | -38 | -48 | -45 | 25.6 | 107 |
| MAJOR Purchases | ||||||
| Current | -64 | -51 | -47 | -50 | 0.0 | 114 |
| Future | -69 | -56 | -58 | -65 | 12.9 | 96 |
| Total number of months: | 114 | |||||

Tom Moeller
AuthorMore in Author Profile »Prior to joining Haver Analytics in 2000, Mr. Moeller worked as the Economist at Chancellor Capital Management from 1985 to 1999. There, he developed comprehensive economic forecasts and interpreted economic data for equity and fixed income portfolio managers. Also at Chancellor, Mr. Moeller worked as an equity analyst and was responsible for researching and rating companies in the economically sensitive automobile and housing industries for investment in Chancellor’s equity portfolio. Prior to joining Chancellor, Mr. Moeller was an Economist at Citibank from 1979 to 1984. He also analyzed pricing behavior in the metals industry for the Council on Wage and Price Stability in Washington, D.C. In 1999, Mr. Moeller received the award for most accurate forecast from the Forecasters' Club of New York. From 1990 to 1992 he was President of the New York Association for Business Economists. Mr. Moeller earned an M.B.A. in Finance from Fordham University, where he graduated in 1987. He holds a Bachelor of Arts in Economics from George Washington University.
More Economy in Brief


