 Global| Mar 25 2008
Consumer Confidence Fell Sharply
by:Tom Moeller
|in:Economy in Brief
Summary
The Conference Board reported today that consumer confidence in March again fell sharply. The 15.6% m/m decline to a reading of 64.5 followed February's 12.4% drop. It was the sharpest two month decline since late 1991. A consensus of [...]
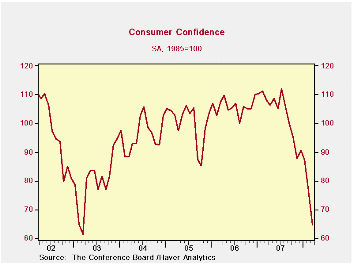
The Conference Board reported today that consumer confidence in March again fell sharply. The 15.6% m/m decline to a reading of 64.5 followed February's 12.4% drop. It was the sharpest two month decline since late 1991. A consensus of economists foresaw less of a decline in March to a level of 73.8.
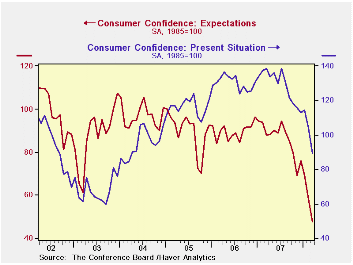
The expectations component of the index fell 17.4% m/m and dropped the level to its lowest since the 1970s. Expectations for business conditions and for income dropped sharply while expectations for the inflation rate surged to 6.1%, its highest since 2005.
Respondents planning to buy a household appliance dropped sharply.
The present conditions index also fell a sharp 14.2% m/m to the lowest level since mid 2004.
Just 15.4% of respondents saw business conditions as good, the lowest since 2003. Jobs as plentiful were seen by 18.8% while 25.1% saw them as hard to get, the highest since mid 2005.
| Conference Board (SA, 1985=100) | March | February | Y/Y % | 2007 | 2006 | 2005 |
|---|---|---|---|---|---|---|
| Consumer Confidence Index | 64.5 | 76.4 | -40.4 | 103.4 | 105.9 | 100.3 |
| Present Situation | 89.2 | 104.0 | -35.6 | 128.8 | 130.2 | 116.1 |
| Expectations | 47.9 | 58.0 | -45.5 | 86.4 | 89.7 | 89.7 |
by Tom Moeller March 25, 2008
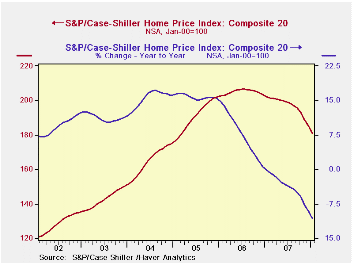
The S&P/Case-Shiller Composite 20 home price index fell 2.4% m/m in January. As a result this index of U.S. home prices was down 10.7% from January of 2007, a record decline for this series which dates back only to 2000. Home prices have fallen in every month since July of 2006 and the decline over that period totals 12.5%.
The index of 20 U.S. cities and their surrounding areas is not adjusted for the quality or the size of the home. The home price index from the Office of Federal Housing Enterprise Oversight (OFHEO) does make these adjustments. This series indicates that during the fourth quarter of 2007 house prices rose a negligible 0.8% y/y, the weakest gain since 1990.
The Case-Shiller composite index of homes in a fewer 10 a metropolitan areas fell 2.3% (-11.4% y/y) last month.
Home prices in San Francisco prices fell 13.2% and prices in Miami Florida also fell sharply by 19.3% y/y. Home prices in Las Vegas Nevada matched that decline and fell 19.3% y/y while in Los Angeles prices fell 16.5% y/y.
Relatively moderate declines were registered in New York (-5.8% y/y), Chicago (-6.6% y/y), Denver (-5.1% y/y) and San Diego California (-5.8% y/y).
An overview of the S&P/Case-Shiller home price series can be found here.
The S&P/Case-Shiller home price series can be found in Haver's REGIONAL database.
| S&P/Case-Shiller Home Price Index (NSA, Jan 00 = 100) | January | December | Y/Y | 2006 | 2005 | 2004 |
|---|---|---|---|---|---|---|
| 20 City Composite Index | 180.65 | 185.01 | -10.7% | -3.8% | 7.6% | 15.8% |
by Tom Moeller March 25, 2008
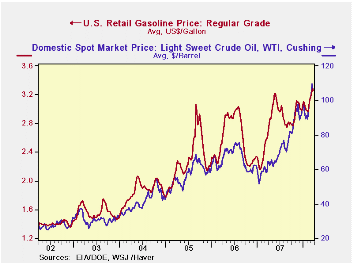
Retail gasoline prices ticked down two cents last week after rising strongly during each of the prior five weeks. The retreat to $3.26 per gallon was so modest that prices so far in March are still up 6.6% from February. They were roughly stable for three months before that.
Yesterday, the wholesale price of unleaded gasoline continued strong. A five cent rise in Monday's price to $2.48 per gallon versus Friday pulled gas prices up nearly a dime versus last week's average.
Crude oil prices also retreated with last week's average price for WTI crude down three dollars w/w to $106.02 per bbl. Yesterday crude prices backed off even further to $101.07 per barrel.
Natural gas prices also topped last week and were down w/w to $9.12 /mmbtu. Nevertheless, natural gas prices were up sharply from February and were up by nearly one third versus last year.
These energy price series are available in Haver's Daily and Weekly databases.
Globalization and the Determinants of Domestic Inflation is a panel discussion held by Janet L. Yellen, President of the San Francisco Federal Reserve Bank and it is available here.
| Weekly Prices | 03/24/08 | 03/17/08 | Y/Y | 2007 | 2006 | 2005 |
|---|---|---|---|---|---|---|
| Retail Gasoline ($ per Gallon) | 3.26 | 3.28 | 24.9% | 2.80 | 2.57 | 2.27 |
| Light Sweet Crude Oil, WTI ($ per bbl.) | 106.02 | 109.43 | 81.0% | 94.00 | 61.11 | 58.16 |
| Natural Gas Price, Henry Hub ($/mmbtu) | 9.12 | 9.75 | 42.3% | 6.96 | 6.74 | 8.68 |
by Tom Moeller March 25, 2008
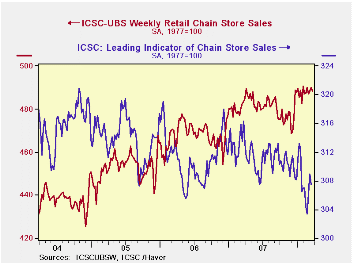
The International Council of Shopping Centers ICSC-UBS Chain Store survey indicated that chain store sales last week fell 0.4% and gave back all of the prior week's modest increase. The decline left sales so far in March up a negligible 0.1% after February's 0.4% rise.
During the last ten years there has been a 45% correlation between the y/y change in chain store sales and the change in nonauto retail sales less gasoline.The ICSC-UBS retail chain-store sales index is constructed using the same-store sales (stores open for one year) reported by 78 stores of seven retailers: Dayton Hudson, Federated, Kmart, May, J.C. Penney, Sears and Wal-Mart.
During the latest week the leading indicator of chain store sales from ICSC-UBS also retreated 0.5% after the prior week's 0.9% increase.
| ICSC-UBS (SA, 1977=100) | 03/21/08 | 03/14/08 | Y/Y | 2007 | 2006 | 2005 |
|---|---|---|---|---|---|---|
| Total Weekly Chain Store Sales | 488.3 | 490.1 | 1.0% | 2.8% | 3.3% | 3.6% |
by Louise Curley March 25, 2008

 Iceland's action is in stark contrast to that of the
majority of developed nations who are lowering rates to combat the
spreading effects of the sub prime crisis. Iceland's problems appear to
have little to do with the financial turmoil resulting from the sub
prime crisis, rather its problems appear to be more the result of its
role in the "Carry Trade." (Investors borrow money in low interest
countries, say in Japan, and invest the proceeds in high interest
countries, say in Iceland. Providing that exchange rates are relatively
stable, the trade is profitable. When exchange rates go against the
borrower, the trade becomes unprofitable.) Iceland with its relatively
high interest rates was a favorite recipient of funds in the "Carry
Trade". With relative stability in exchange rates in the period from
2002 to 2006, the Carry Trade was, for the most part, very profitable.
When exchange rates began rising in the low interest countries in 2007
and falling in the high interest countries, the Carry Trade lost much
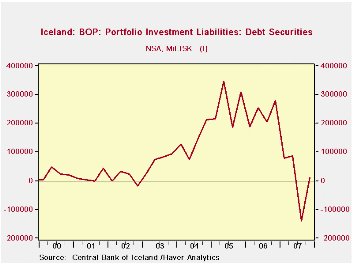
of its appeal. Inflows were reduced and, in some cases, reversed. The
ups and downs in the carry trade in Iceland are shown in the second
chart which shows the dramatic rise in the inflow of foreign investment
in debt securities. These flows rose dramatically beginning in 2003,
holding at high levels through 2006, plummeting in most of 2007 and
recovering slightly in the last quarter.
The Carry Trade inflows are more like "hot money" flows
than more long term oriented inflows. As such they tend to cause
disruptions in an economy. Among other things, they result in bigger
current account deficits and, unless they are sterilized, they tend to
add to inflationary pressures.
Iceland's action is in stark contrast to that of the
majority of developed nations who are lowering rates to combat the
spreading effects of the sub prime crisis. Iceland's problems appear to
have little to do with the financial turmoil resulting from the sub
prime crisis, rather its problems appear to be more the result of its
role in the "Carry Trade." (Investors borrow money in low interest
countries, say in Japan, and invest the proceeds in high interest
countries, say in Iceland. Providing that exchange rates are relatively
stable, the trade is profitable. When exchange rates go against the
borrower, the trade becomes unprofitable.) Iceland with its relatively
high interest rates was a favorite recipient of funds in the "Carry
Trade". With relative stability in exchange rates in the period from
2002 to 2006, the Carry Trade was, for the most part, very profitable.
When exchange rates began rising in the low interest countries in 2007
and falling in the high interest countries, the Carry Trade lost much
of its appeal. Inflows were reduced and, in some cases, reversed. The
ups and downs in the carry trade in Iceland are shown in the second
chart which shows the dramatic rise in the inflow of foreign investment
in debt securities. These flows rose dramatically beginning in 2003,
holding at high levels through 2006, plummeting in most of 2007 and
recovering slightly in the last quarter.
The Carry Trade inflows are more like "hot money" flows
than more long term oriented inflows. As such they tend to cause
disruptions in an economy. Among other things, they result in bigger
current account deficits and, unless they are sterilized, they tend to
add to inflationary pressures.
| ICELAND | Q4 08 | Q3 07 | Q1 07 | Q/Q Chg | Y/Y Chg | 2006 | 2005 | 2004 |
|---|---|---|---|---|---|---|---|---|
| Inflows of Foreign Invest in Debt Securities (Mil Korona) | 11,212 | -138,609 | 278,074 | 149,981 | -266,862 | 37,891 | 925,191 | 1,057,402 |

Tom Moeller
AuthorMore in Author Profile »Prior to joining Haver Analytics in 2000, Mr. Moeller worked as the Economist at Chancellor Capital Management from 1985 to 1999. There, he developed comprehensive economic forecasts and interpreted economic data for equity and fixed income portfolio managers. Also at Chancellor, Mr. Moeller worked as an equity analyst and was responsible for researching and rating companies in the economically sensitive automobile and housing industries for investment in Chancellor’s equity portfolio. Prior to joining Chancellor, Mr. Moeller was an Economist at Citibank from 1979 to 1984. He also analyzed pricing behavior in the metals industry for the Council on Wage and Price Stability in Washington, D.C. In 1999, Mr. Moeller received the award for most accurate forecast from the Forecasters' Club of New York. From 1990 to 1992 he was President of the New York Association for Business Economists. Mr. Moeller earned an M.B.A. in Finance from Fordham University, where he graduated in 1987. He holds a Bachelor of Arts in Economics from George Washington University.
More Economy in Brief


